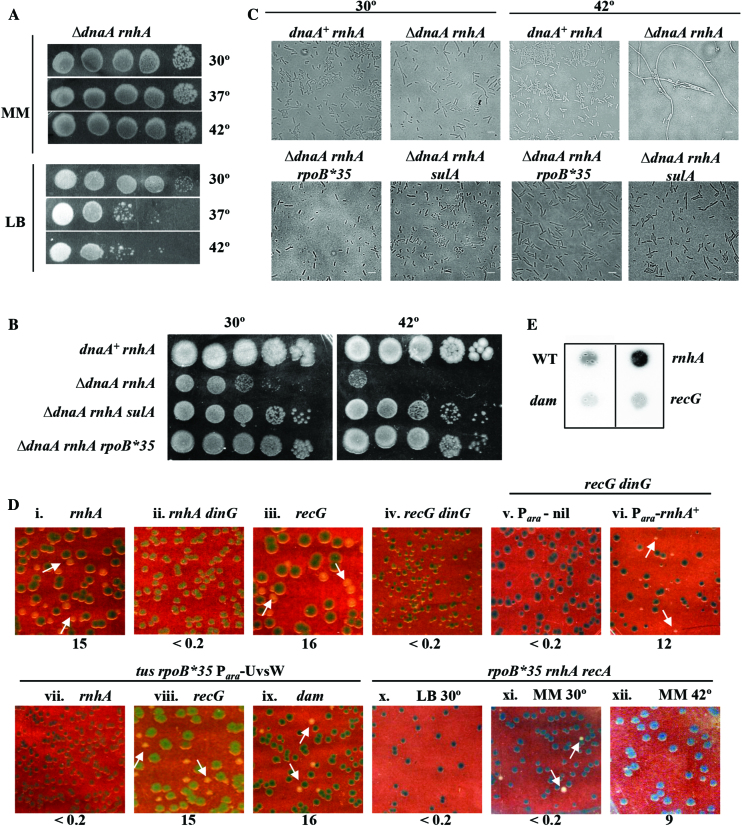
Figure 5.
cSDR features in rnhA and recG mutants. Spotting at serial 10-fold dilutions, at the indicated temperatures, of suspensions of: (A) GJ16476 (ΔdnaA rnhA) on LB and glucose-minimal A (MM); and (B) in order, GJ16476/pHYD2388, GJ16476, GJ16498 and GJ18612 on LB. (C) Phase contrast microscopy of cultures of strains shown in panel B, after growth at 30°C or 42°C. Scale bar, 3 μm. (D) Plating of isogenic derivatives of ΔdnaA strain carrying dnaA+ shelter plasmid pHYD2388 and the additional genetic perturbation(s) as indicated on top of each panel on (unless otherwise indicated) LB-Xgal at 37°; representative images are shown, and the percentage of white colonies to total for each panel is indicated as explained in the legend to Figure 2. Strains employed for the different panels were pHYD2388 (or pHYD4805, in case of recG mutants) derivatives of: i, GJ16476; ii, GJ18620; iii, GJ16464; iv, GJ16489; v, GJ18621; vi, GJ18622; vii, GJ18623; viii, GJ16490; ix, GJ18627; and x-xii, GJ16499. Plates depicted in panels v–ix were supplemented with 0.2% arabinose. The plate of panel x was incubated at 30°C; while those of panels xi and xii comprised glucose-minimal A medium (MM) incubated at 30°C and 42°C, respectively. (E) Immunoblotting with S9.6 monoclonal antibody of total nucleic acids prepared from cultures of wild-type (WT) strain GJ13519 and its isogenic rnhA, dam, or recG derivatives GJ15833, GJ18617, and GJ17503, respectively.

