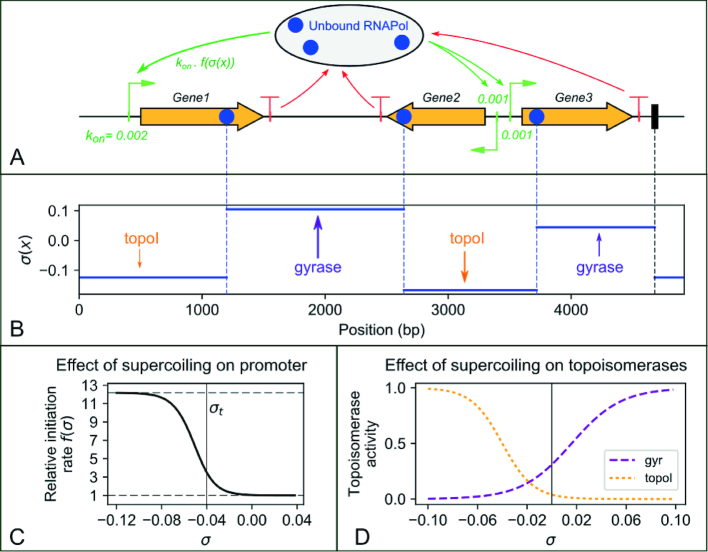
Figure 1.
Illustration and main components of the transcription-supercoiling coupling model. (A) Snapshot of the simulation of the stochastic binding (green arrows; the basal initiation rate kon of each promoter is shown), elongation, and dissociation (red arrows) of a set of RNAPs along a 1D genome (here a 5-kb plasmid). (B) The SC profile is updated at each timestep, and is affected by elongating RNAPs as well as by topoisomerase activity. This level is constant between topological barriers, i.e., either elongating RNAPs (blue) or fixed proteic barriers (black). (C) The local SC level affects each promoter through an activation curve derived from thermodynamics of open complex formation, which modulates its specific strength (basal initiation rate). (D) Topoisomerases bind in a deterministic but heterogeneous way, according to the local SC level (see text).

