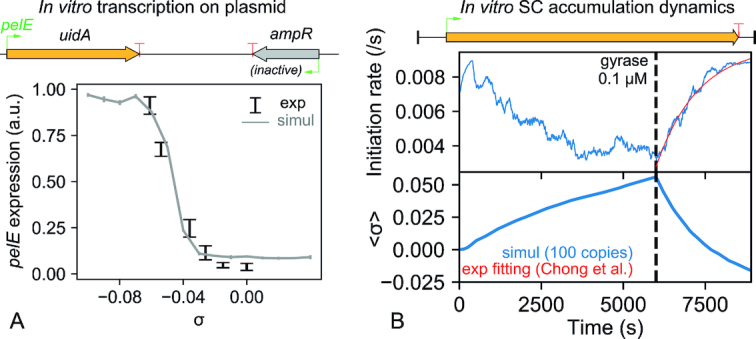
Figure 2.

Calibration of the model on in vitro transcription experiments with plasmids. (A) The promoter activation curve (Figure 1C) is calibrated from pelE expression levels measured on purified plasmids prepared at different SC levels (4). Due to the absence of topological barriers in the plasmid, transcription-induced supercoils do not accumulate and SC levels remain constant. In this assay, this promoter from Dickeya dadantii is activated around 20-fold by negative SC. The weakly expressed promoter ampR was kept inactive in the simulations. (B) Topoisomerase activity constants are calibrated from a SC accumulation assay (22). The instantaneous initiation rate (top) was measured over time, and is reproduced by our simulations where the average plasmid SC level can be inferred (bottom). Positive supercoils first accumulate in the absence of DNA gyrase, resulting in a progressive repression of the promoter, and are then released in an exponential timecurve (red curve) reflecting gyrase activity.
