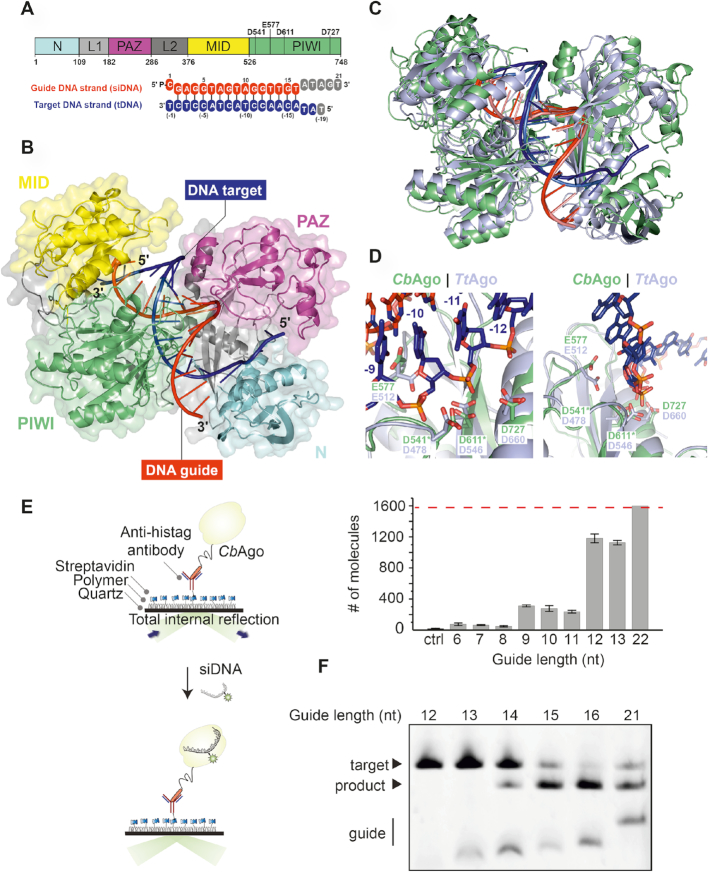
Figure 2.
Structure of CbAgo in complex with a siDNA and a DNA target. (A) Upper panel: Schematic diagram of the domain organization of CbAgo. L1 and L2 are linker domains. Lower panel: Sequences of the siDNA (red) and target DNA (blue). Nucleotides that are unordered in the structure are coloured grey. See also Supplementary Table S1. (B) Overall structure of the CbAgo-siDNA-target DNA complex. Domains are coloured according to the colour scheme in panel A. (C) Structural alignment of CbAgo (green) and TtAgo (light purple; PDB: 4NCB). Core Root Mean Square Deviation of 3.0 Å over 563 residues. (D) Close-up views of the aligned DDED catalytic sites of CbAgo (green) and TtAgo (light purple; PDB: 4NCB). Modelled side chains of D541 and D611 in CbAgo are indicated with green asterisks. The glutamate finger of both pAgos (E512 in TtAgo or E577 in CbAgo) are inserted into the catalytic site. The scissile phosphate between nucleotide −10 and −11 of the target DNA strand (blue) is indicated with a black asterisk in the left panel. (E) Total internal reflection microscopy (TIRM) was used to determine the minimal length for siDNA to be bound by CbAgo. Left panel: Graphical overview of the TIRM method. Right panel: Histogram with TIRM results demonstrated that synthetic siDNAs of at least 12 nt in length are efficiently bound by CbAgo. The red line indicates the total number of countable molecules within the microscope image. The raw microscope images are given in Supplementary Figure S5. (F) CbAgo mediates target DNA cleavage with siDNAs as short as 14 nucleotides. CbAgo was incubated with siDNA and target DNA in a 1:1:1 ratio. Cleavage products were analyzed by denaturing polyacrylamide electrophoresis.

