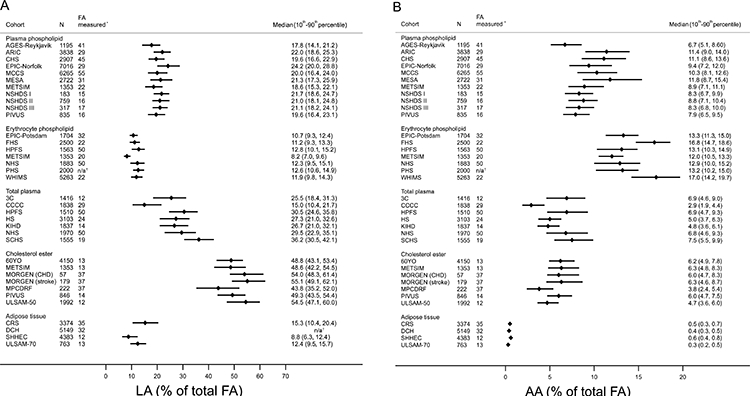
Figure 1. Concentration of A) linoleic acid (LA; 18:2n6) and B) arachidonic acid (AA; 20:4n6) across different biomarker compartments measured in the 31 contributing studies.

Concentrations of arachidonic acid and linoleic acid concentrations are expressed as % of total fatty acids (FA), and indicated as median (circles) and interquintile range (lines; defined as the range between the midpoint of the bottom quintile [10th percentile] and the top quintile [90th percentile]), respectively. For MPCDRF and the MORGEN, values are only shown for controls.*Total number of individual FA measured in the biomarker compartment. †Not reported.
