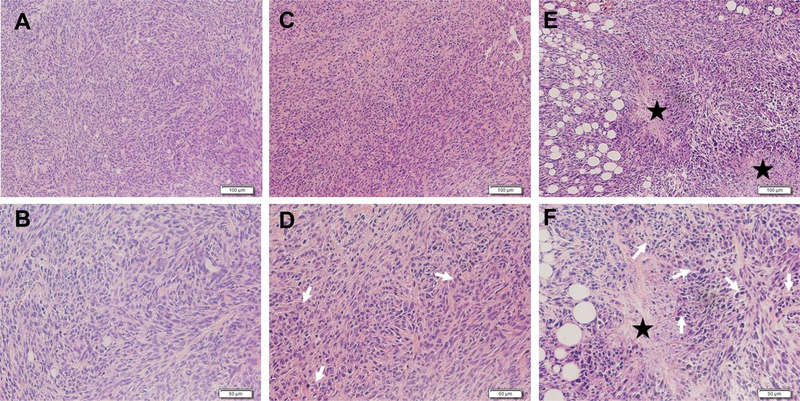
Fig.7.
Representative H&E images of M-Wnt tumors in C57BL/6 mice i.v. injected with PBS (A-B), free Zol (C-D), and Zol-NPs (E-F). Tumor tissues are represented by two different magnifications (100 × (top), 200 × (bottom)). The scale bars in the 100 × images represent 100 μm, and those in the 200 × images represent 50 μm. White arrows represent apoptotic cells, and stars represent necrotic areas.

