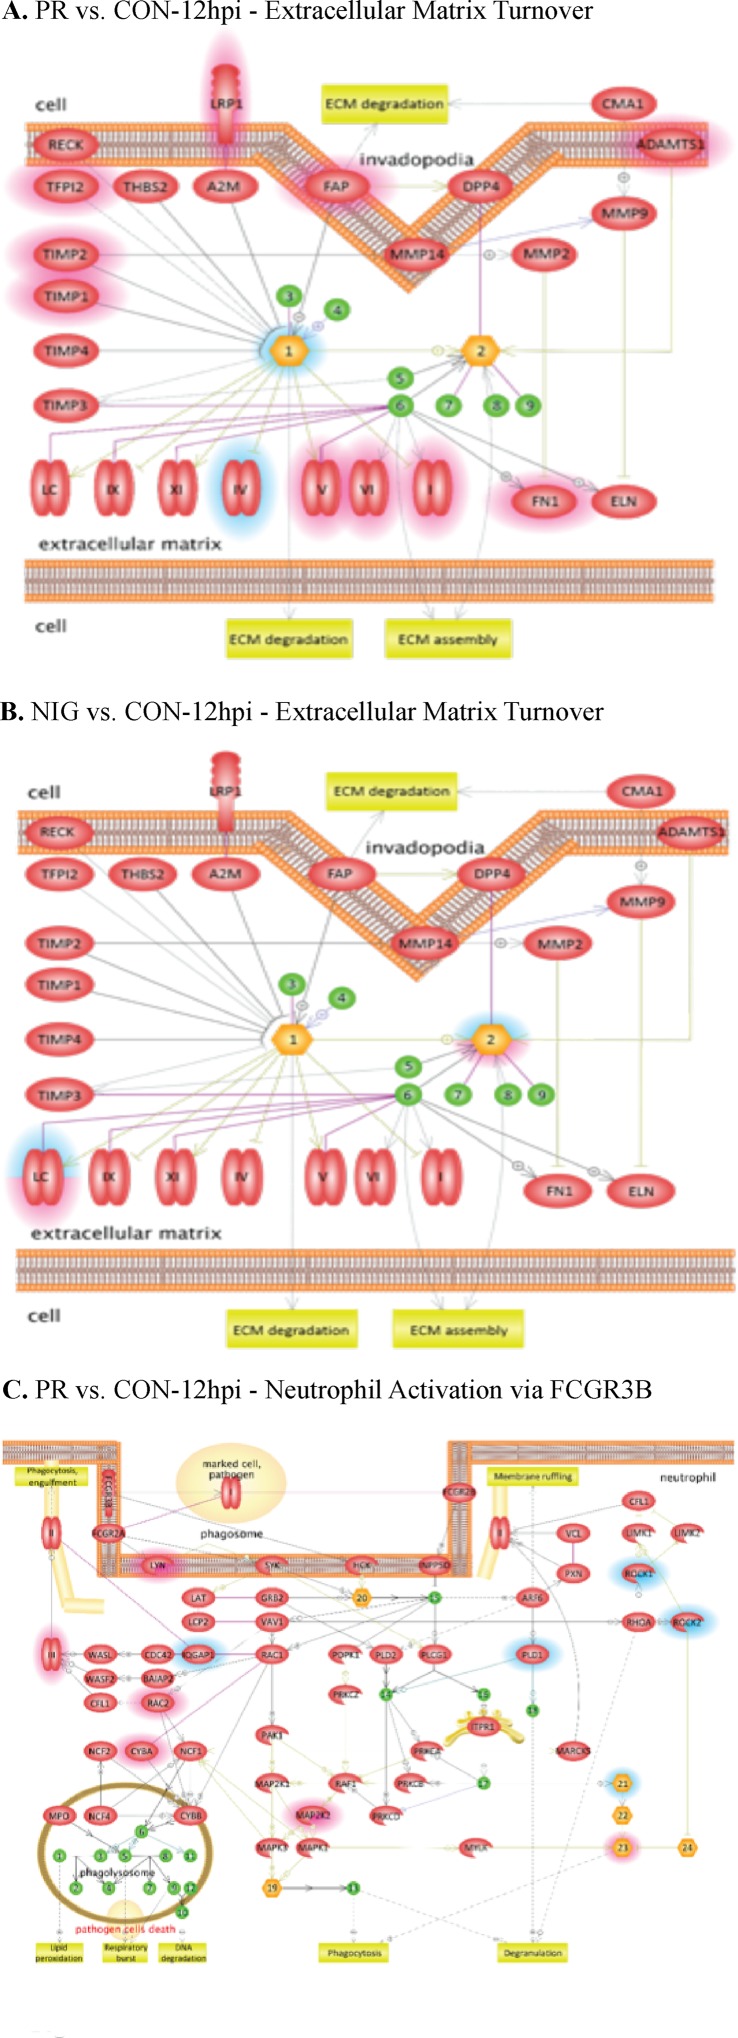
Figure 3.
Pathway analysis of transcriptome data. Pathway analysis was done using the Pathway Studio MammalPlus (Elsevier) tool. Analytes that differ significantly between groups were used for enrichment analysis. Only pathways with p < 0.05 after correction for the multiple comparison were selected. Blue color highlights analytes, which were significantly lower in IBH30656 ZIKV-infected HUVECs. (A) PR vs.CON-12hpi – Extracellular matrix Turnover; (B) NIG vs.CON-12hpi – Extracellular matrix Turnover; (C) - PR vs. CON-12hpi -Neutrophil Activation via FCGR3B.

