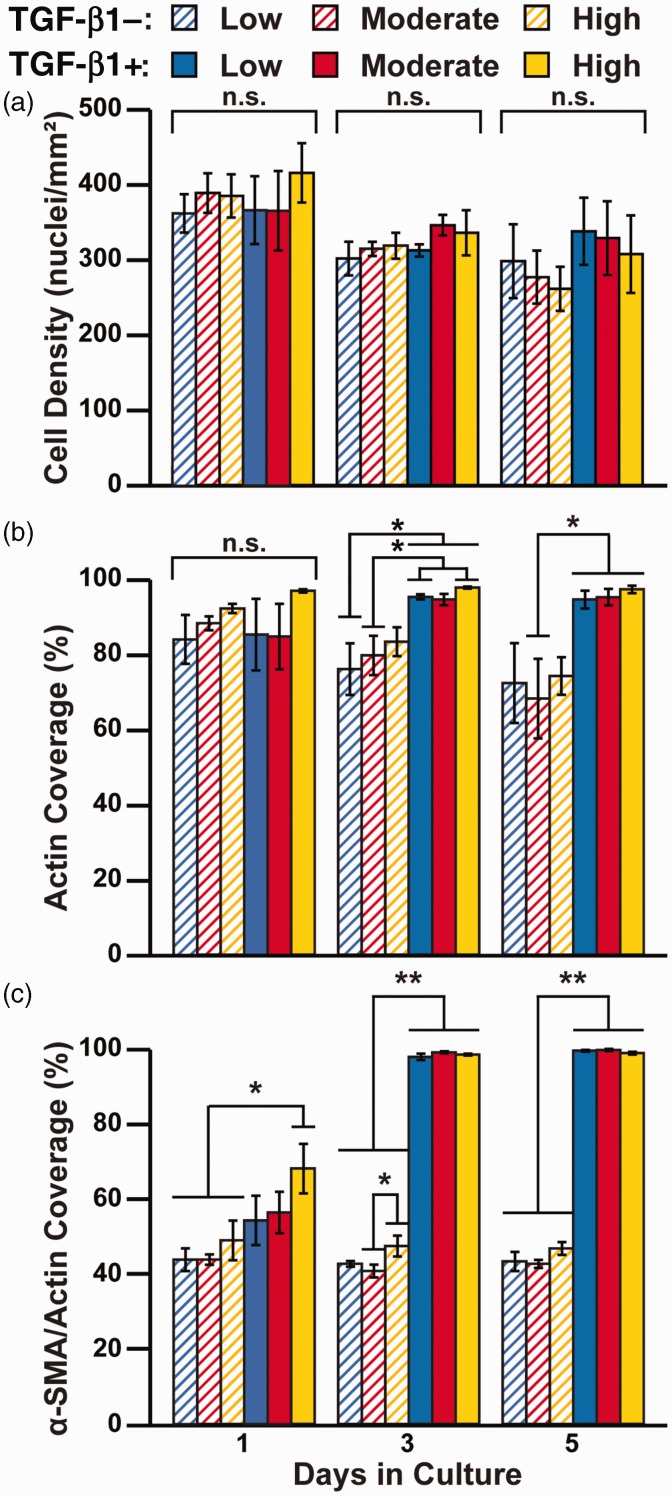
Figure 3.
Quantification of cell morphology and α-SMA expression due to ECM rigidity and TGF-β1 treatment. Human cardiac fibroblasts were cultured on low, moderate, and high PDMS-coated coated coverslips with or without 2 ng/mL TGF-β1 for one, three, and five days. Cells were immunostained and cell density (a), actin coverage (b), and α-SMA/actin coverage (c) were quantified from immunostained images (n = 4, bars indicate mean ± standard error of the mean, *P < 0.05 and **P < 0.01 according to one-way ANOVA and Tukey’s test for multiple comparisons. For detailed statistical analysis, see Supplementary Tables S2 to S4). (A color version of this figure is available in the online journal.)

