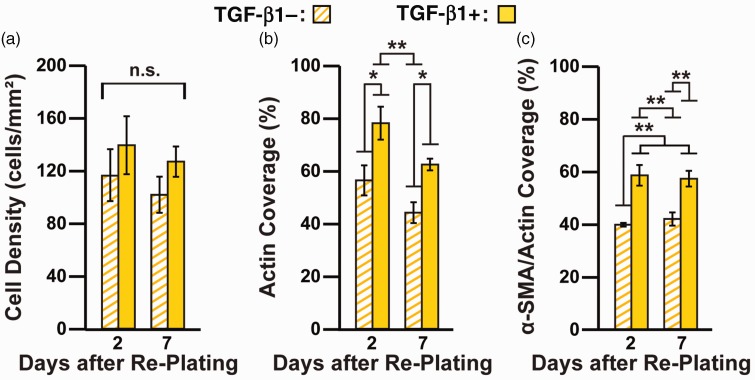
Figure 5.
Quantification of cell morphology and α-SMA expression after re-plating untreated and TGF-β1-treated cells in the absence of TGF-β1. On day 3, untreated and TGF-β1-treated cells on high PDMS coverslips were trypsinized, re-plated onto high PDMS coverslips, and maintained without TGF-β1 for an additional two and seven days. Cells were immunostained and cell density (a), actin coverage (b), and α-SMA/actin coverage (c) were quantified from immunostained images (n = 4, bars indicate mean ± standard error of the mean, *P< 0.05 and **P< 0.01 according to one-way ANOVA and Tukey’s test for multiple comparisons. For detailed statistical analysis, see Supplementary Tables S10 to S12). (A color version of this figure is available in the online journal.)

