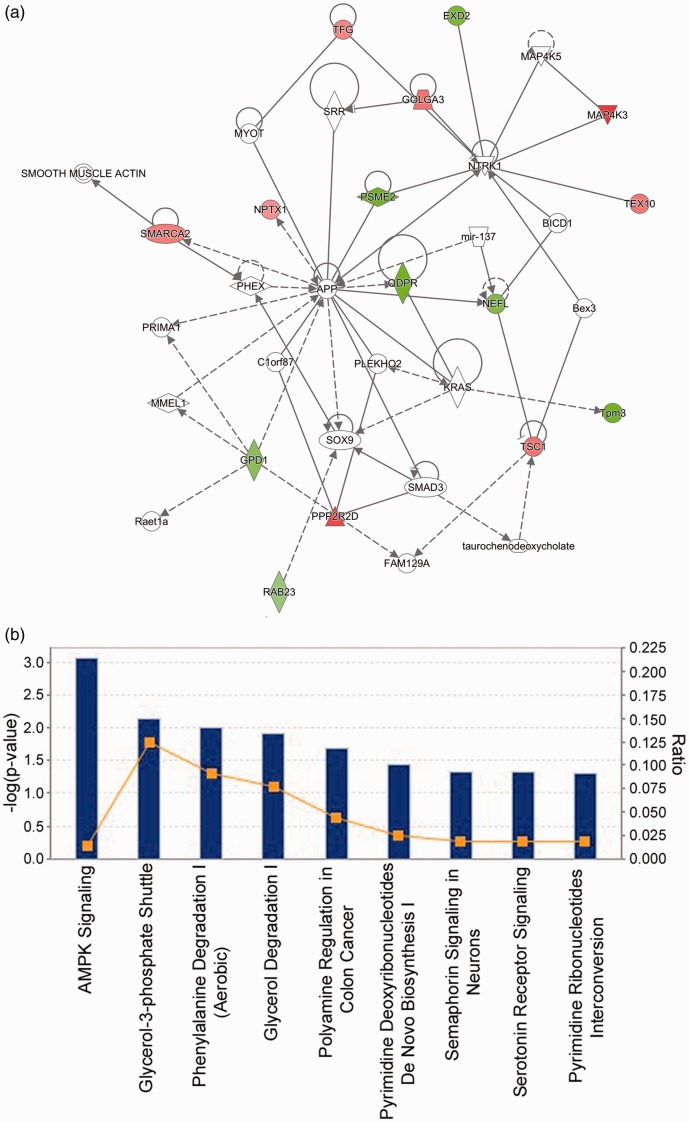
Figure 6.
Pathway and functional annotation. (a) IPA analysis showed that the differentially expressed proteins in HDAC3-overexpressing CGNs are associated with cell-to-cell signaling and interaction, cellular assembly and organization, and cellular function and maintenance. Fifteen out of the 21 identified proteins are involved in this network. Green color shows downregulation by HDAC3 while red color represents upregulation. The color intensity indicates the degree of protein level change. Solid lines in the network indicate direct interactions between proteins and dashed lines imply indirect interactions. Geometric shapes represent various general functional protein groups (diamond for enzyme, oval for transcription regulator, trapezoid for transporter, inverted triangle for kinase, double circle for complex/group, and circle for others). Proteins in white shapes are not part of our data set but have relationships with our proteins in the network. (b) Top IPA canonical pathways targeted by HDAC3 in CGNs are presented. These pathways were ranked according to their −log (P value) (blue bars). A ratio (orange square) indicates the number of identified proteins found in each pathway over the total number of proteins in that pathway. (A color version of this figure is available in the online journal.)

