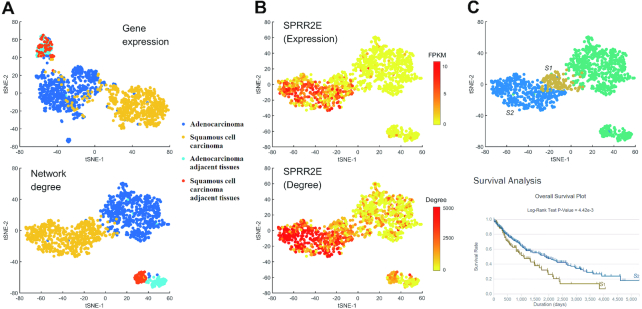
Figure 6.
Comparison of GEM and NDM based on TCGA adenocarcinoma and squamous cell carcinoma bulk RNA-seq data. (A) Clustering performance (t-SNE) between GEM and NDM. Different colors represent different cell types. (B) The expression level FPKM and network degree of gene SPRR2E. (C) Squamous cell carcinoma can be divided into two parts S1 and S2 based on NDM, and the survival analysis shows the significant difference between S1 and S2.

