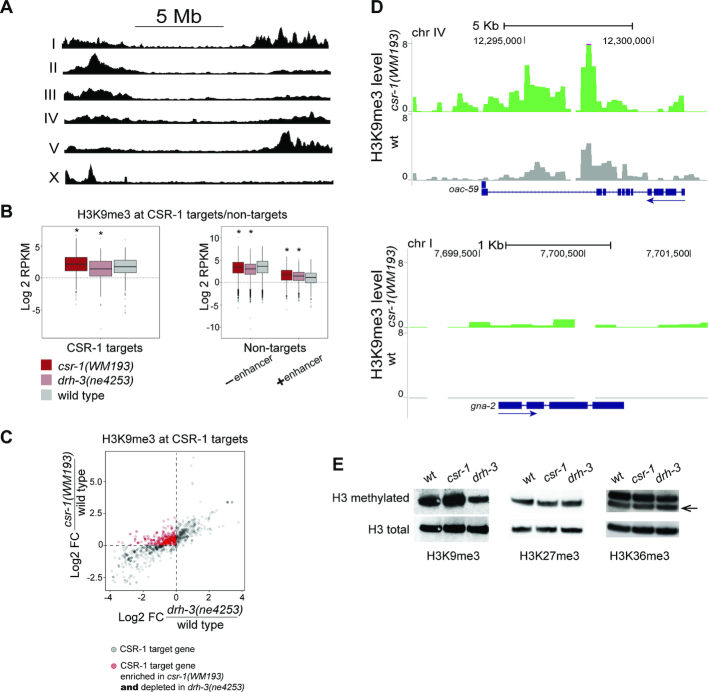
Figure 1.
H3K9me3 alterations at CSR-1 target genes in partially rescued csr-1(tm892) and drh-3(ne4253) mutants. (A) On the C. elegans autosomes, H3K9me3 is enriched at the chromosome arms and, on the X chromosome, only at the left arm. Read coverage in wild type worms (L3) normalized to, sequentially, RPKM and input is shown. (B) A box plot (left) demonstrates an increase of H3K9 methylation at CSR-1 target genes in csr-1(WM193), but not in drh-3(ne4253). ChIP-seq data were normalized as described in methods. Significant changes (P < 10−4) are marked by an asterisk: csr-1(WM193): Med = 2.16, P-value = 2.7 × 10⁻¹³ (Wilcoxon test); drh-3(ne4253): Med = 1.40, P-value = 4 × 10⁻⁴ (Wilcoxon test); wild type: Med = 1.75. A box plot (right) demonstrates a decrease in H3K9me3 at CSR-1 non-target genes not containing enhancers (– enhancer) in both csr-1(WM193) and drh-3(ne4253), and elevated H3K9me3 at non-target genes containing enhancers (+ enhancer). Significant changes (P < 10−4) are marked by an asterisk: No enhancer: csr-1(WM193): Med = 3.50, P-value = 6.1 × 10⁻¹⁵ (Wilcoxon test); drh-3(ne4253). Med = 3.08, P-value < 2 × 10⁻¹⁶ (Wilcoxon test); wild type: Med = 3.70. Enhancer: csr-1(WM193): Med = 1.70, P-value = 2.6 × 10⁻⁸ (Wilcoxon test); drh-3(ne4253): Med = 1.45, P-value = 2.5 × 10⁻⁷ (Wilcoxon test); wild type: Med = 1.10. (C) A scatter plot shows an enrichment of H3K9me3 in csr-1(WM193) compared to wild type and a depletion of H3K9me3 in drh-3(ne4253) compared to wild type in the large group of CSR-1 target genes (red circles). CSR-1 target genes with detectable H3K9me3 coverage in at least one strain were selected. The fold changes compared to wild type were then calculated and log2 -transformed. Changes in csr-1(WM193) are shown on the Y-axis, while changes in drh-3(ne4253) are shown on the X-axis; this allows simultaneous comparison of the same genes between the two mutants. The dashed lines identify a group of genes (red circles) that are enriched in H3K9me3 in csr-1(WM193) (above the horizontal line) and are depleted in drh-3(ne4253) (to the left of vertical line) compared to wild type. (D) Coverage tracks at two CSR-1 target genes of different sizes and exon/intron composition. In wild type (gray), H3K9me3 is very low (upper plot) or not detected (lower plot), whereas in csr-1(WM193) (green), an increase in H3K9me3 is observed. TMM and CPM normalization was performed followed by input reads subtraction from each sample. The directionality of gene transcription is marked with blue arrows. (E) The global level of H3K9me3 at the L3 stage larvae increases in the csr-1(WM193) mutant compared to wild type. On the contrary, the H3K9me3 level in drh-3(ne4253) is reduced. The levels of H3K27me3 and H3K36me3 do not change globally.

