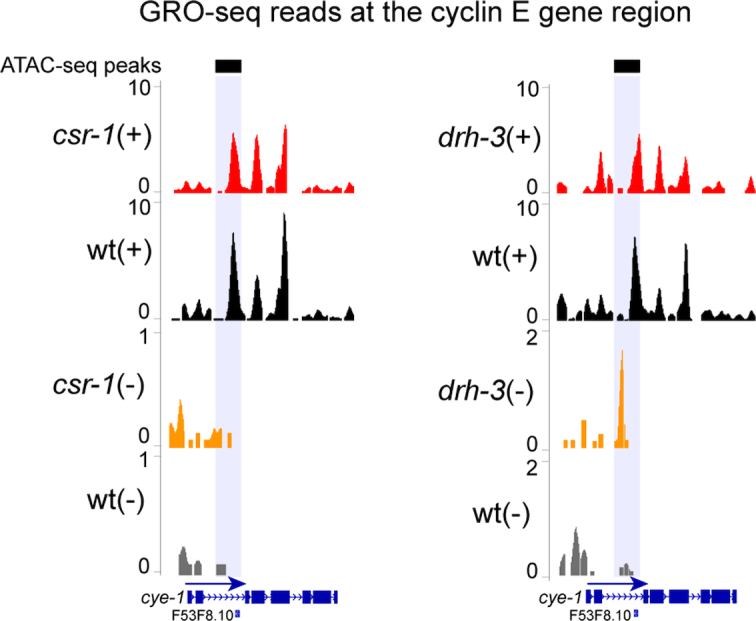
Figure 2.

Distribution of GRO-seq reads at the cye-1 gene region. (top) A reduction in GRO-seq read numbers on the plus (+) strand in csr-1(WM193) (left plot) and drh-3(ne4253) (right plot) compared to wild type (red versus black) illustrates a decrease in cye-1 gene transcription. (bottom) On the minus (–) strand, there is an increase in GRO-seq reads in csr-1 (left plot) and drh-3 (right plot) mutants compared to wild type (orange versus gray) at the intronic enhancer region (gray shading) detected by ATAC-seq (black bars) (25). The directionality of transcription is marked with a blue arrow. Normalization was performed as described in methods.
