Figure 3.
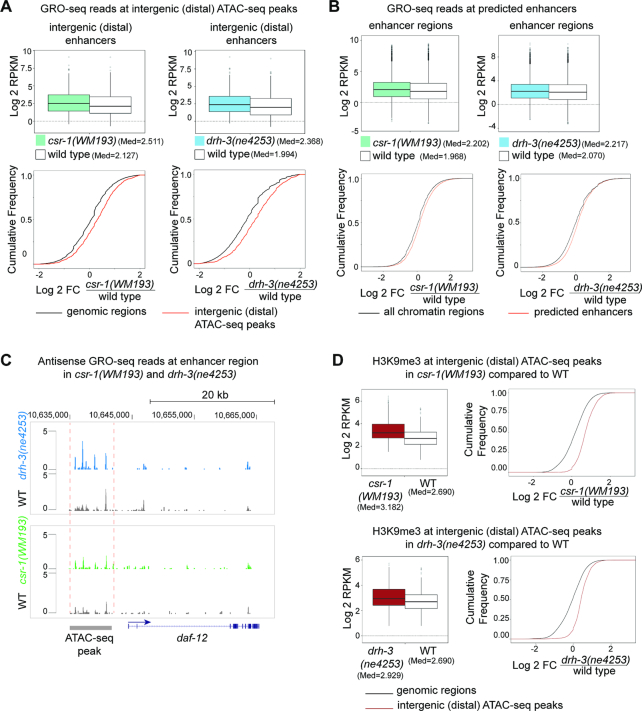
Elevated H3K9me3 and transcription at enhancer regions in csr-1(WM193) and drh-3(ne4253). (A) GRO-seq read coverage is increased at the distal enhancer regions (intergenic ATAC-seq peaks) in csr-1 (left panel) and drh-3 (right panel) mutants: top – box plots, bottom – cumulative read distribution plots. P-value = 8.694 × 10⁻¹³ and P-value < 2.2 × 10⁻¹⁶ correspond to the left and the right box plots, respectively (Wilcoxon test). The GRO-seq data from (38) were normalized as described in Materials and Methods and the log2 transformed RPKM was plotted. Cumulative plots confirm the box plot data analyses for csr-1 (left) and drh-3 (right) mutants and demonstrate an increase in GRO-seq reads coverage in both mutants at distal enhancer regions (ATAC-seq data from (25)) compared to cumulative GRO-seq reads counted in 2.5 Kb regions from the whole genome with the exception of ATAC-seq peaks (i.e. genomic regions). (B) Box plots demonstrate an increase in total GRO-seq read coverage at the putative enhancers (26) in csr-1 (left) or drh-3 (right) mutant L3 larva. The GRO-seq data (38) were normalized as described in methods, and the log2 transformed RPKM was plotted. P-values < 2.2 × 10⁻¹⁶ (Wilcoxon test). Cumulative plots confirm the box plot data analyses for csr-1 (left) and drh-3 (right) mutants and show an increase in GRO-seq read coverage in both mutants at the predicted enhancers (26). Analysis of cumulative distribution of log2 -transformed fold changes of GRO-seq RPKM values was performed for genome-wide regions not containing putative enhancers (all chromatin domains) and for combined domains 8, 9 and 10 (26) containing putative enhancer regions. (C) GRO-seq reads corresponding to antisense transcription are shown at a region containing a regulatory element detected by ATAC-seq upstream of the daf-12 gene. The directionality of sense transcription is marked with a blue arrow. An increase in the number of antisense reads is shown in drh-3 (blue) and csr-1 (green) mutants compared to wild type (gray). (D) Box plots and cumulative plots show increased H3K9me3 at distal (intergenic) enhancers detected by ATAC-seq (25) in csr-1 and drh-3 mutants compared to wild type. ChIP-seq data normalization was performed as described in methods. The cumulative genome-wide regions not containing ATAC-seq peaks were defined by dividing the genome into windows (genomic regions) of 2.5 kb. P-values < 2.2 × 10⁻¹⁶ (Wilcoxon test).

