Figure 3.
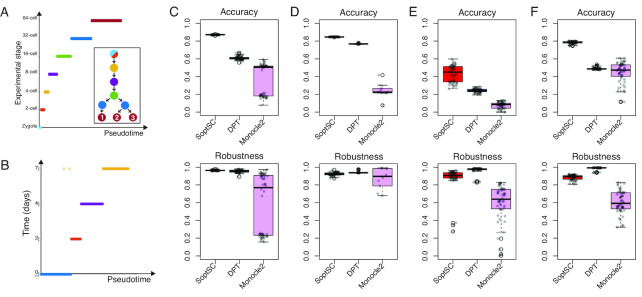
Assessment of SoptSC for pseudotime inference. (A) Pseudotemporal ordering of data from mouse early embryo development (55) is compared with the known biological stage. Inset shows the lineage inferred by SoptSC, colored by experimental stage of origin for each cluster. (B) Pseudotemporal ordering of embryonic stem cell data from (52) compared with experimental time. (C) Comparison of three methods for pseudotime inference with data from (55) using the Kendall rank correlation between pseudotime and experimental stage as a measure of accuracy, and by subsampling 90% of cells from the data 50 times (and comparison of subsets) to measure robustness. (D) Comparison as for (C) with embryonic stem cell data from (52). (E) Comparison as for (C) with bone-marrow-derived dendritic cells (56). (F) Comparison as for (C) with cells from the murine epidermis (32). Here the accuracy is measured by comparison with the pseudotime inferred in the original study.

