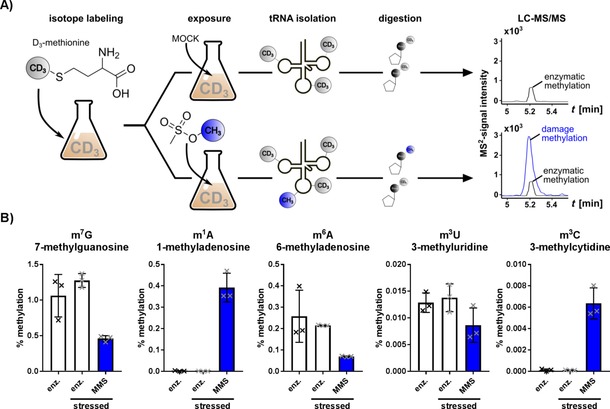
Figure 3.

Concept sketch of the RNA methylome discrimination assay. A) CD3‐methionine‐containing medium is used for metabolic labeling of native tRNA methylations. Enzymatic methylation (black) and MMS‐derived methylation (blue) are distinguished by mass spectrometry. B) Methylation sites in canonical ribonucleosides found in vivo and sorted by abundance (left: high; right: low). The abundance of methylated nucleosides from unstressed cells is compared to that of enzymatically derived nucleosides (white) and MMS‐derived nucleosides (blue bars) from MMS‐exposed cells. Error bars represent the standard deviation of three biological replicates.
