Figure 2.

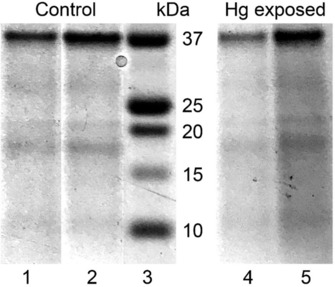
SDS‐PAGE electropherograms of the MT extracts after thermal denaturation under argon. Lane 1=5 μL and lane 2=10 μL from the mussel control, lane 3=mass markers in kDa, lane 4=5 μL and lane 5=10 μL from the Hg exposed mussels (MT).

SDS‐PAGE electropherograms of the MT extracts after thermal denaturation under argon. Lane 1=5 μL and lane 2=10 μL from the mussel control, lane 3=mass markers in kDa, lane 4=5 μL and lane 5=10 μL from the Hg exposed mussels (MT).