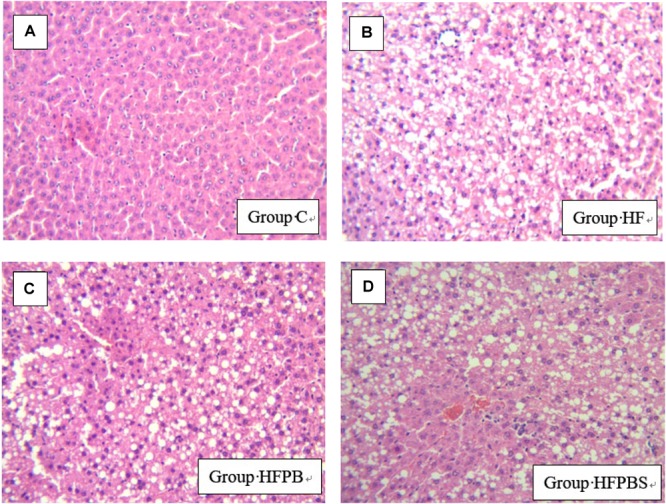
FIGURE 1.

Histopathological examination of liver tissue showing damage and arrangement of hepatocytes and fat vacuoles (100× magnification) (n = 10). (A) Tissue from the C group showing a normal liver with no lipid deposits. (B) Liver tissue from the HF group showing the presence of steatosis. (C) Tissue from the HFPB group showing the presence of steatosis. (D) Cells from the HFPBS group containing many large fat vacuoles.
