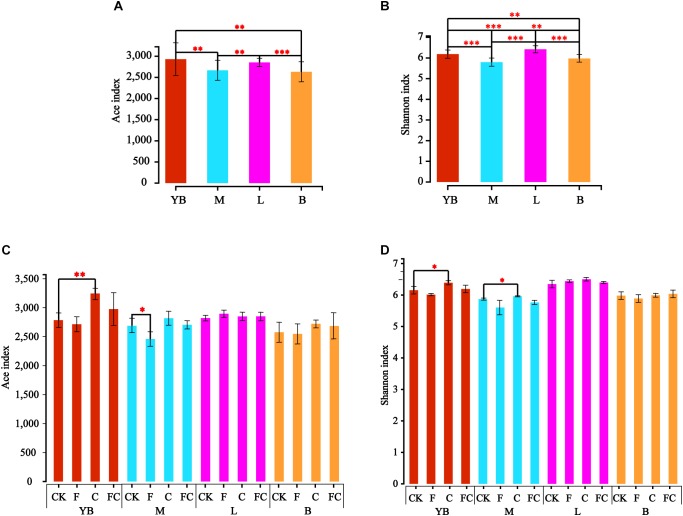
FIGURE 1.
Inter-group difference test for alpha diversity index. (A,B) Represent the test results of the Ace index and the Shannon index for different soils. Panels (C,D) show the calculation results of the Ace index and the Shannon index between the treatment and the control in the same soil. ∗∗∗Correlation is significant at the 0.001 level. ∗∗Correlation is significant at the 0.01 level. ∗Correlation is significant at the 0.05 level.

