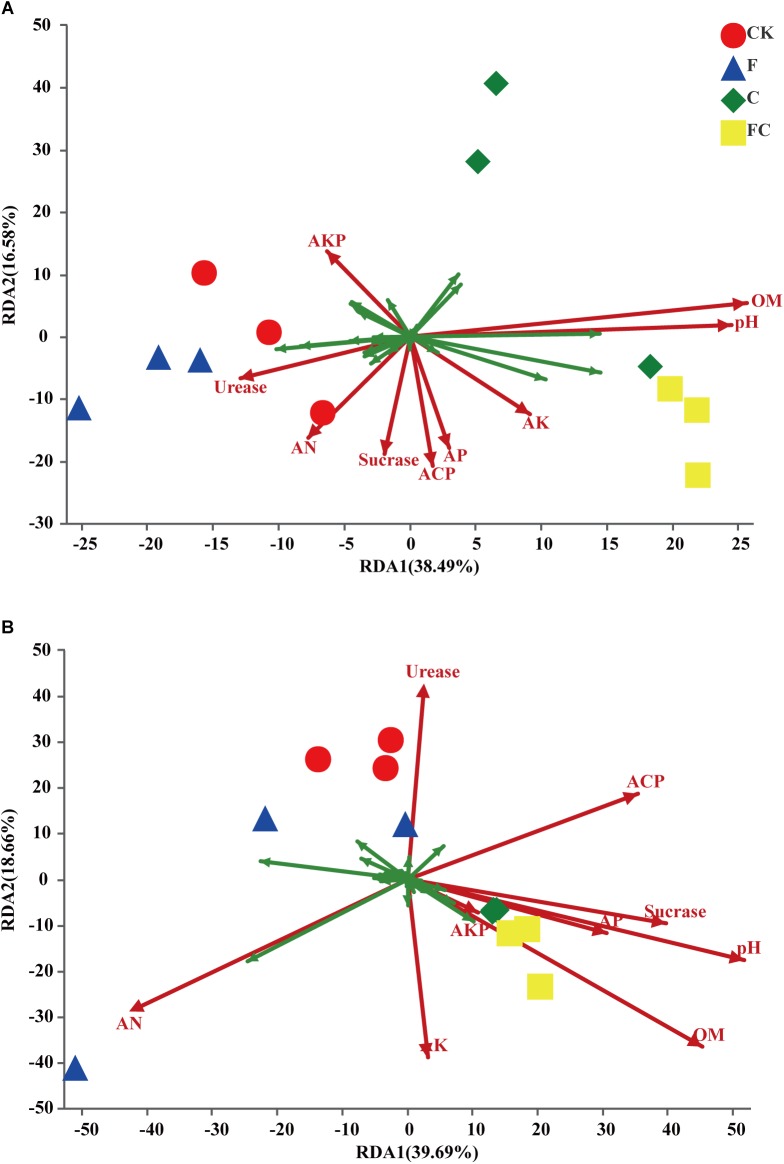
FIGURE 6.
Results of redundancy analysis of acidic soils. (A,B) Represent yellow brown soil and fluvo-aquic soil, respectively. The figure shows the top 30 OTUs with high relative abundance. The green arrow represents the species and red arrow represents the environmental factor. pH, AN, AP, AK, OM, Urease, Sucrase, ACP, AKP represent pH, alkali nitrogen, available phosphorus, available potassium, organic matter, urease, sucrase, acid phosphatase, and alkaline phosphatase in two soils, respectively.

