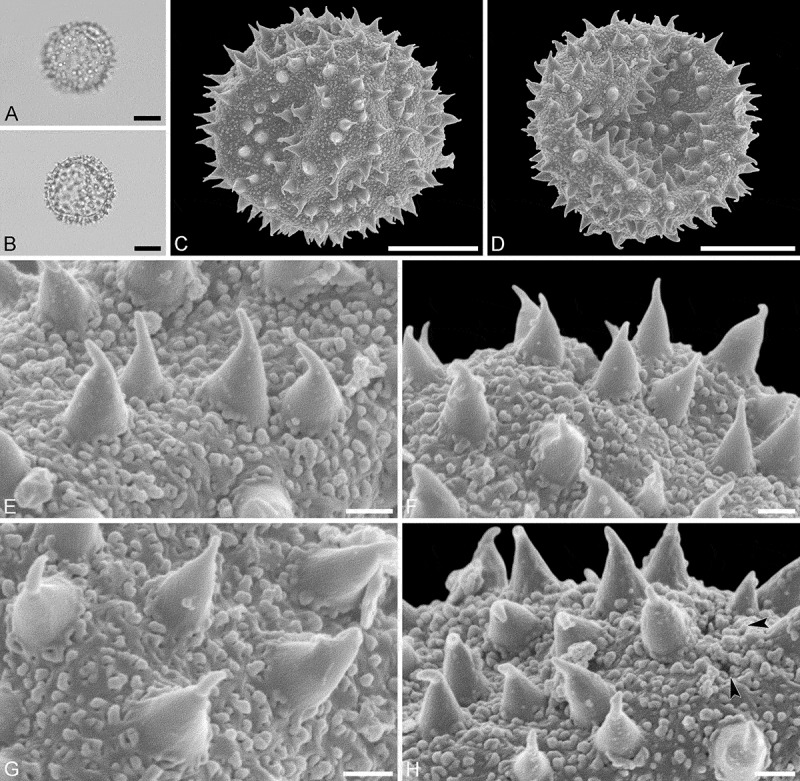
Figure 18.

Light microscopy (A, B) and scanning electron microscopy (C–H) micrographs of the Profen MT (same grain: A–H). A. Polar view, high focus. B. Polar view, optical cross-section. C. Polar view. D. Polar view, opposite site, grain infolded. E. Close-up of interapertural area. F. Close-up of interapertural area. G. Close-up of interapertural area. H. Close-up of aperture, showing membrane (arrows). Scale bars – 10 µm (A–D), 1 µm (E–H).
