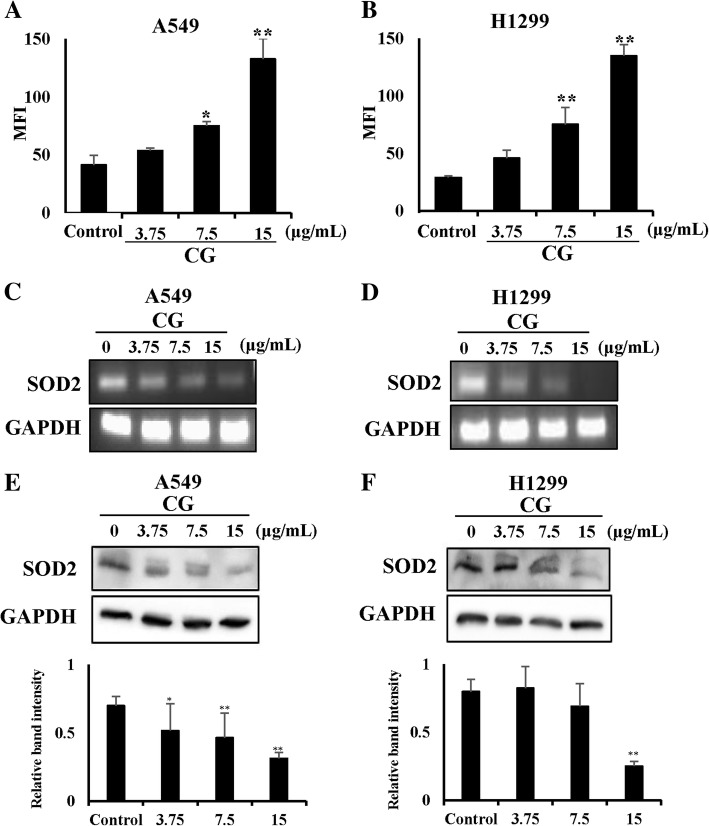
Fig. 7.
ROS generation induced by CG in A549 and NCI-H1299 cells. CG treatment resulted in ROS generation in A549 (a) and NCI-H1299 (b) cells. Cells were treated with CG for 48 h and examined using DCF-DA staining and a fluorescence microplate reader. The mRNA expression of SOD2 and GAPDH was determined by PCR analysis in A549 (c) and NCI-H1299 (d) cells treated with CG extract for 48 h. Western blots of SOD2 and GAPDH protein expression in CG-treated A549 (e) and NCI-H1299 (f) cells. The data are presented as the mean ± SEM (n = 3). The data were analyzed using one-way ANOVA with Tukey’s HSD test. *, p < 0.05 and **, p < 0.005

