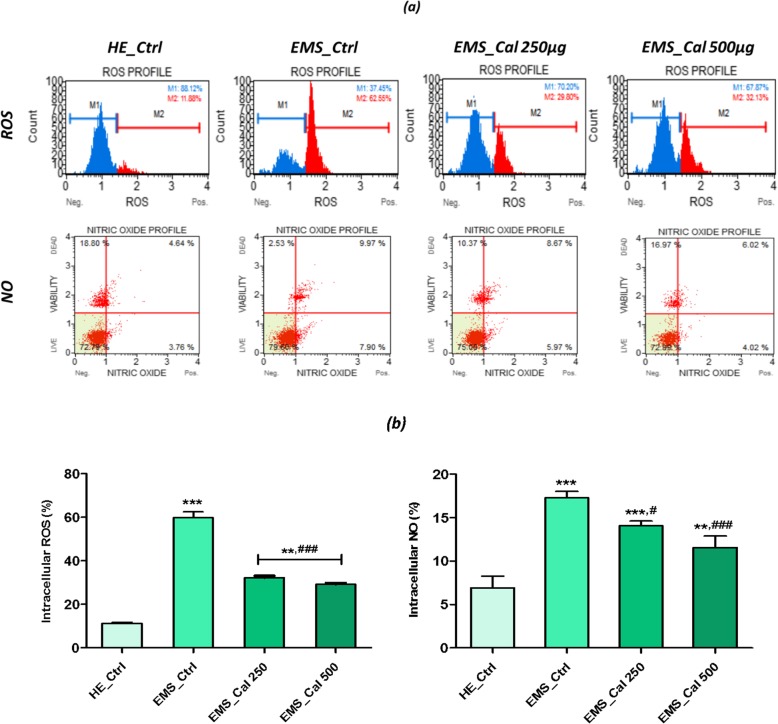
Fig. 5.
Effect of calystegines on ROS and NO levels in EMSASCs cells. a Representative plots depicting cell stained with DHE and DAX-J2 Orange dyes and evaluated using a flow cytometer. b Each bar represents the mean ± SEM of three independent experiments for intracellular ROS and NO. Ctrl_HE healthy control cells, Ctrl_EMS EMS control cells, EMS_Cal 250 EMS cells treated with 250 μg/ml of calystegines, EMS_Cal 500 EMS cells treated with 500 μg/ml of calystegines. Asterisk (*) refers to the comparison of EMS treated and untreated groups to untreated healthy cells. Hashtag (#) refers to comparison of EMS treated groups to EMS untreated cells. */#p < 0.05, **/##p < 0.01, ***/###p < 0.001

