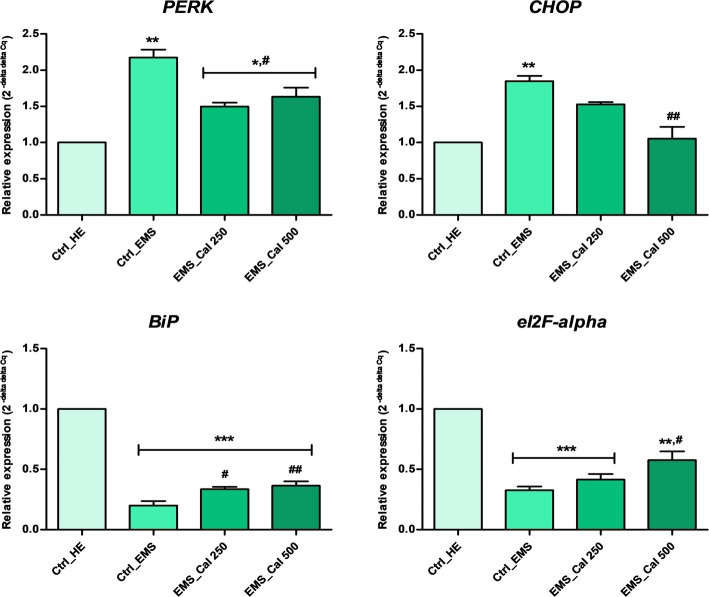
Fig. 8.
RT-PCR analysis of main ER stress-related markers after calystegine treatment on EMSASCs cells. Data are expressed as mean of three independent experiments ± SD. Ctrl_HE healthy control cells, Ctrl_EMS EMS control cells, EMS_Cal 250 EMS cells treated with 250 μg/ml of calystegines, EMS_Cal 500 EMS cells treated with 500 μg/ml of calystegines. Asterisk (*) refers to the comparison of EMS treated and untreated groups to untreated healthy cells. Hashtag (#) refers to the comparison of EMS treated groups to EMS untreated cells. */#p < 0.05, **/##p < 0.01, ***/###p < 0.001

