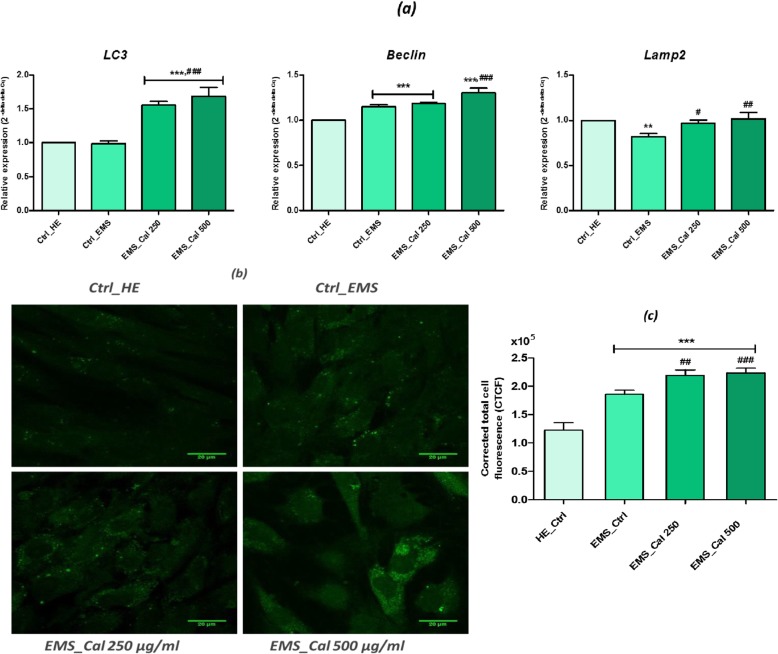
Fig. 9.
Assessment of autophagy in EMSASCs treated with calystegines. a qRT-PCR analysis of key markers involved in autophagy process. b Representative photomicrographs of Lamp2 immunofluorescent staining acquired using a confocal microscope; scale bar size 20 μm; magnification was set at 60-fold. c Bar chart representation of corrected total cell fluorescence (CTCF) for Lamp2 calculated using the ImageJ software. Values are expressed as mean of three independent experiments ± SD. Ctrl_HE healthy control cells, Ctrl_EMS EMS control cells, EMS_Cal 250 EMS cells treated with 250 μg/ml of calystegines, EMS_Cal 500 EMS cells treated with 500 μg/ml of calystegines. Asterisk (*) refers to the comparison of EMS treated and untreated groups to untreated healthy cells. Hashtag (#) refers to the comparison of EMS treated groups to EMS untreated cells. */#p < 0.05, **/##p < 0.01, ***/###p < 0.001

