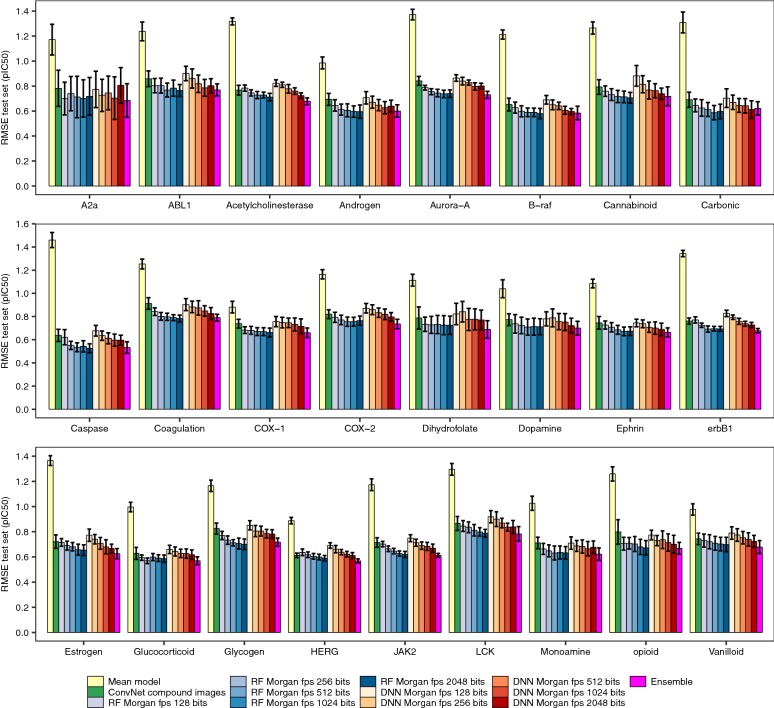
Fig. 6.
Benchmarking the predictive power of ConvNets, DNN and RF models on 25 protein target data sets. Mean RMSE values (± standard deviation) on the test set across ten runs for (1) the ConvNet showing the highest predictive power for each data set and run combination, (2) RF models trained on Morgan fingerprints, (3) DNN trained on Morgan fingerprints, and (4) the ensemble models built by averaging the predictions generated with the RF models trained on Morgan fingerprints of 2048 bits and ConvNet models trained on compound images. As in Fig. 4, the yellow bars correspond to the RMSE values that would be obtained by a model predicting the average bioactivity value in the training data for all the test set instances. Similar to the results obtained for the cytotoxicity data sets, we obtained ConvNets with comparable predictive power to RF and DNN models. As in the case of the cytotoxicity data sets, ensemble models often displayed higher predictive power than either model alone (Eq. 2; P < 10−5)

