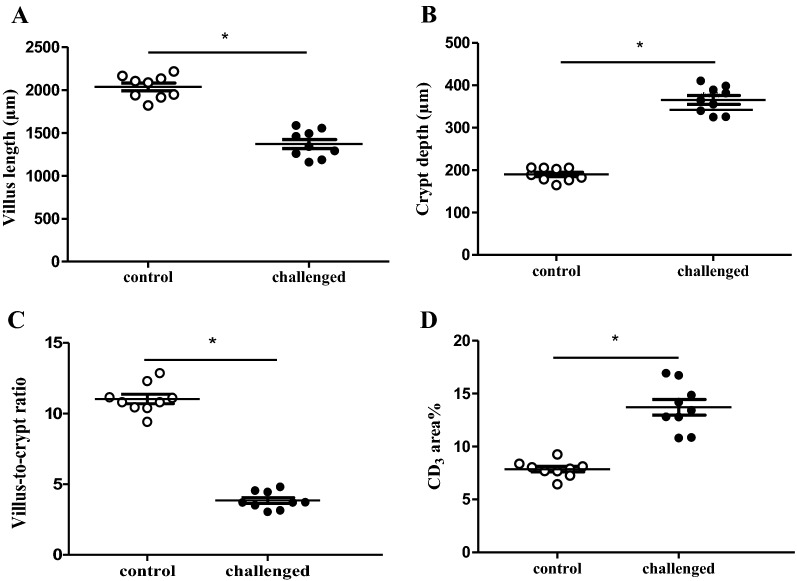
Figure 3.
Histological parameters in duodenal sections from birds derived from the in vivo gut damage trial. 12 villi were randomly selected and measured per section and per animal using Leica DM LB2 microscope and a computer based image analysis program, LAS V4.1. Each dot represents the mean of 3 birds per pen with a total of 9 pens for control (white; n = 27) and challenged (black; n = 27) birds. A Villus length was measured from the crypt–villus junction to villus tip. B Crypt depth was measured from the junction to the base. C Villus-to-crypt ratio. D T-lymphocyte infiltration (CD3 area%) was measured for a total area of 3.5 ± 0.5 mm2. Asterisk denotes statistical significance of p < 0.0001 between control and challenge group.

