Figure 3.

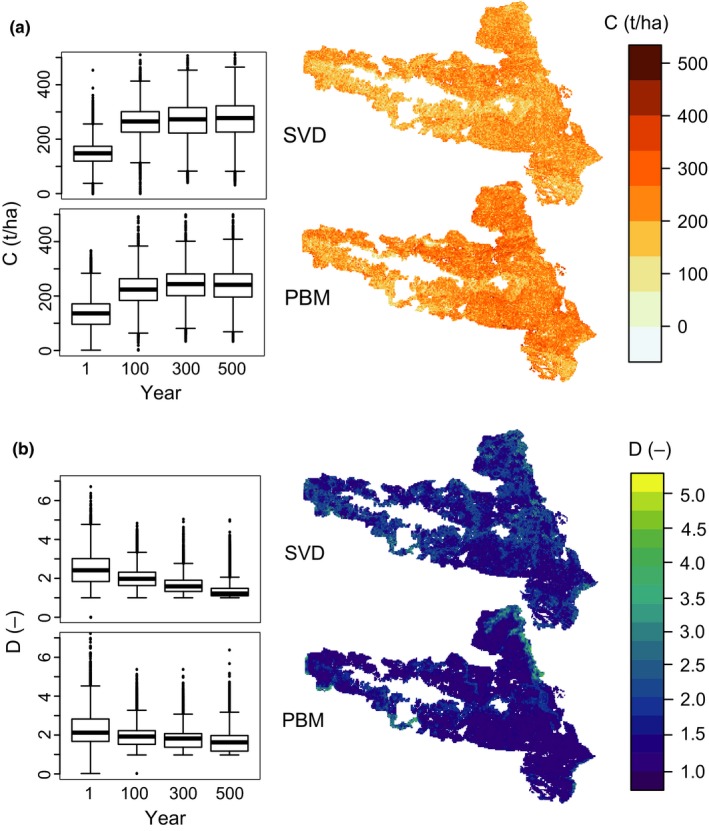
Comparison of the simulated attributes live tree carbon (a) and tree species diversity (b). The boxplots indicate the spatial distribution of the respective attribute over time at the landscape scale. The maps show the spatial distribution of attributes after 500 simulation years. Data is taken from the climate scenario C3 (validation dataset)
