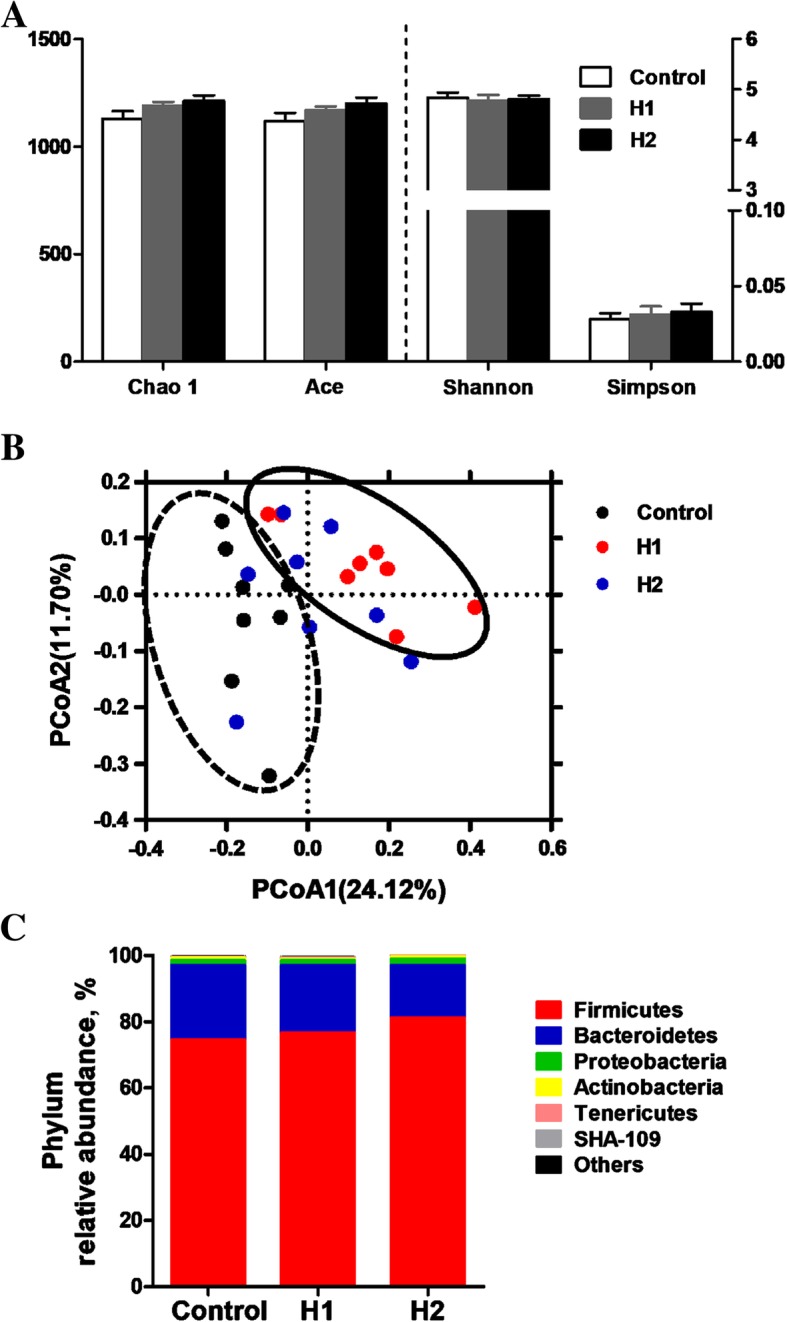
Fig. 1.

a Diversity and richness of colonic digesta microbial community at the 3% dissimilarity level. The values are means ± SEM (n = 8). b Principal coordinates analysis (PCoA) of bacterial communities in the colonic digesta of pigs (based on the Bray-Curtis distance). Circles with dash line or solid indicate that groups were significantly distinct using AMOVA analysis (P < 0.05). c Phylum-level relative abundance of 16S rRNA gene sequences from the colonoc digesta of pigs
