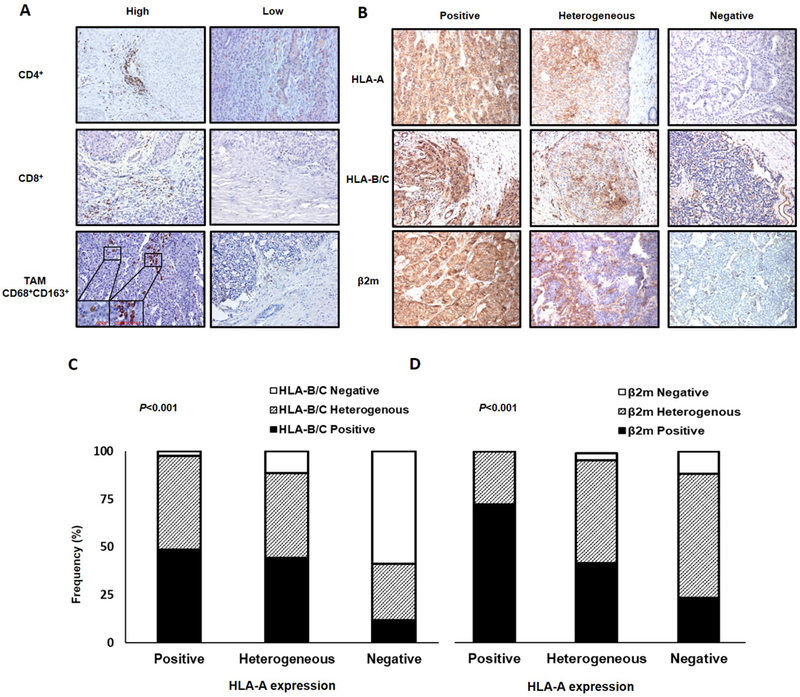
Figure 1.

Immune cell infiltration and HLA class I expression in PanNET tumors. A, PanNET tissue sections were IHC stained with rabbit anti-CD4, mouse anti-CD8, mouse anti-CD68, and rabbit anti-CD163 mAbs. Different levels of CD4+ cell, CD8+ T cell, and TAM (CD68+CD163+) infiltration (X200 original magnification, insets X800 original magnification) are shown. B, PanNET tissue sections were IHC stained with mouse anti-HLA-A mAb HCA2, anti-HLA-B/C mAb HC-10, and anti-β2m mAb NAMB-1. Representative patterns of positive, heterogeneous, and negative HLA-A, HLA-B/C and β2m staining (X200 original magnification) are shown. C, HLA-A expression is significantly associated with HLA-B/C expression (P<0.001). D, HLA-A expression is significantly associateted with β2m expression (P<0.001). P values derived from Fisher exact test.
