Figure 2.

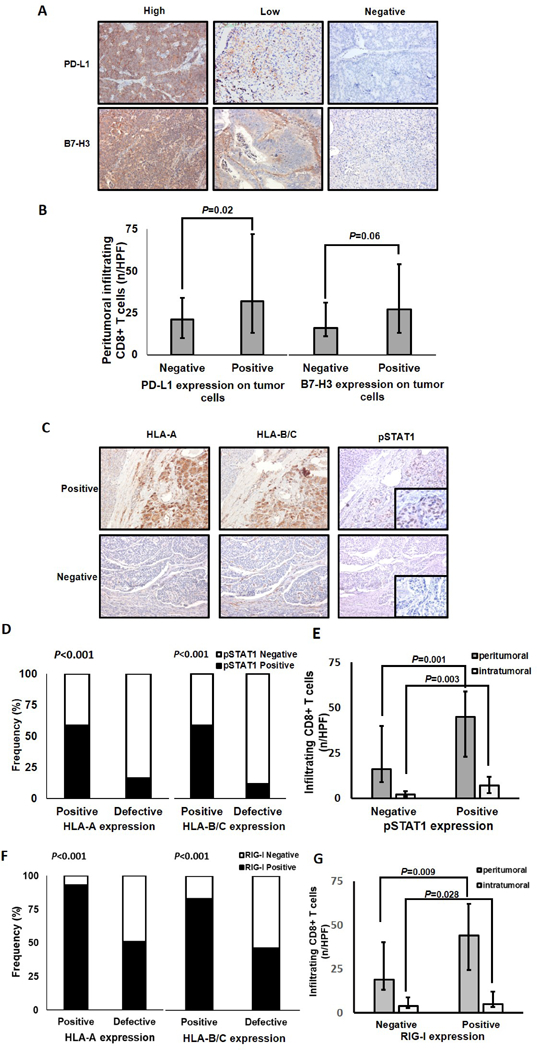
Association of PD-L1, B7-H3, phospho-STAT1, and RIG-I expression with the extent of peritumoral CD8+T-cell infiltration and with HLA class I expression in PanNETs. A, PanNET tissue sections were IHC stained with rabbit anti-PD-L1 mAb and goat anti-B7-H3 pAb. Representative patterns of highly positive embrane/cytoplasmic, scattered positive membrane/cytoplasmic and negative PD-L1 staining (X200 original magnification) are shown. Representative patterns of highly positive membrane/cytoplasmic, low membrane/cytoplasmic and negative B7-H3 staining (X200 original magnification) are shown. B, Peritumoral CD8+ T-cell number is significantly associated with PD-L1 expression (P=0.02), but not with cytoplasmic and/or membranous B7-H3 expression (P=0.06). C, PanNET tissue sections were IHC stained with mouse anti-HLA-A mAb HCA2, mouse anti-HLA-B/C mAb HC-10, rabbit anti-phosphoStat1 (pSTAT1) mAb, and rabbit anti-RIG-I pAb. The positive HLA-A and HLA-B/C expression in PanNETs with positive pSTAT1 expression and the low/negative HLA-A and HLA-B/C expression in PanNETs with negative phosphoStat1 expression (X200 original magnification, insets X400 original magnification) are shown. D, Positive HLA-A and HLA-B/C expression is significantly associated with positive pSTAT1 expression (P<0.001). E, Peritumoral and intratumoral CD8+ T-cell number is significantly associated with pSTAT1 expression (P=0.001 and P=0.003). F, HLA-A and HLA-B/C expression is significantly associated with RIG-I expression (P<0.001). G, Peritumoral and intratumoral CD8+ T-cell number is significantly associated with positive RIG-I expression (P=0.009 and P=0.028). Bars, median values. Error bars, interquartile range. P values derived from Mann–Whitney U tests.
