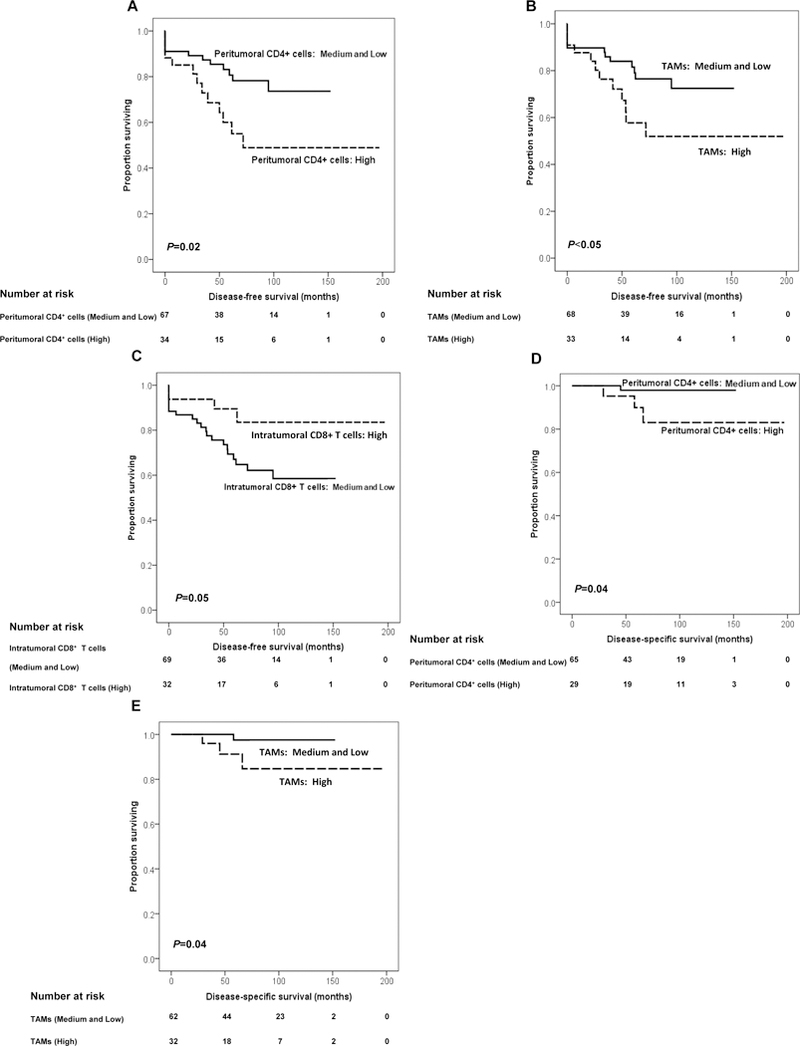
Figure 3.

Association of the extent of tumor infiltration by immune cells with DFS and DSS in patients with PanNET. DFS based on peritumoral CD4+ cell, TAM, and intratumoral CD8+ T-cell number is shown. Prognosis is depicted with Kaplan–Meier curves: (A) for peritumoral CD4+ cell number: high versus medium and low (mean survival: high: 113 vs. medium and low: 123 months, P=0.02), (B) for TAM number: high versus medium and low (mean survival: high: 113 versus medium and low: 121 months, P<0.05); and (C) for intratumoral CD8+ T-cell number: high versus medium and low (mean survival: high: 170 vs. medium and low: 104 months, P=0.05). Disease-specific survival based on peritumoral CD4+ cells and TAM number is shown. Prognosis is depicted with Kaplan–Meier curves: (D) for peritumoral CD4+ cell number: high versus medium and low (mean survival: high: 150 vs. medium and low: 173 months, P=0.04), and (E) for TAM number: high versus medium and low (mean survival: high: 149 vs. medium and low: 175 months, P =0.04). P values derived from log-rank tests.
