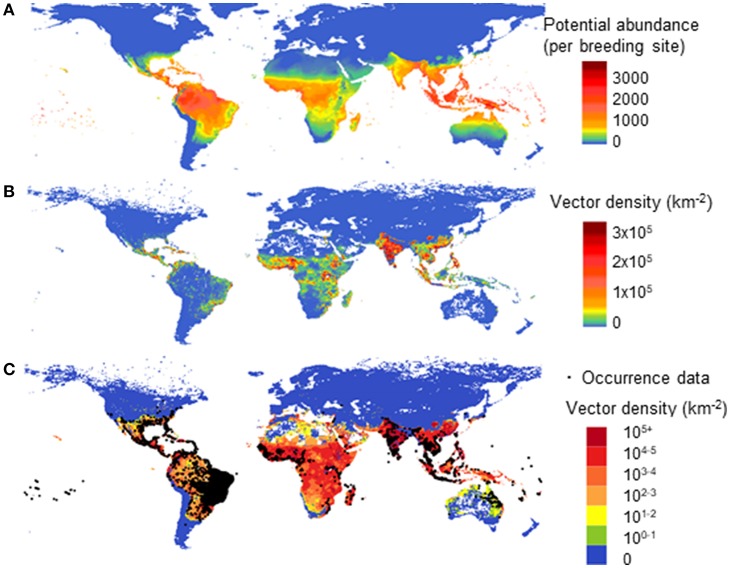
Figure 5.
Model comparison of different drivers on the global distribution for potential abundance and vector density of female Aedes aegypti: using climate only (A—Model A) and climate, human population and GDPpc (B,C—Model B). (A) shows potential vector abundance (per larval site) averaged over the decade 2000–2009 in linear scale. (B,C) show population density averaged over 2006–2015 in linear scale (B) and in log scale where occurrence data was also overlaid (C).

