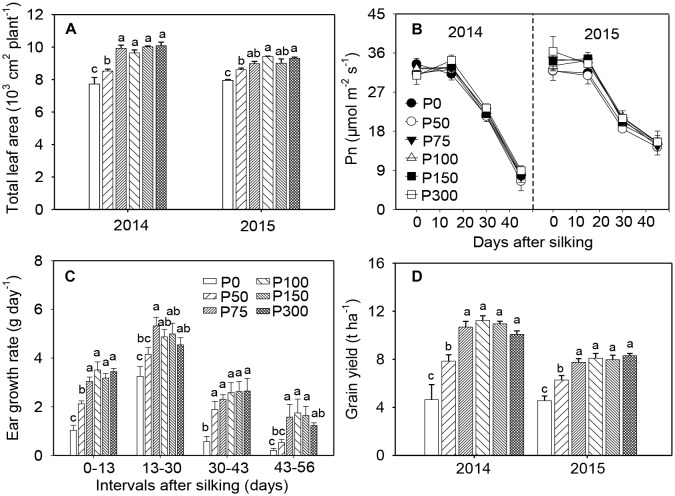
FIGURE 1.
Total leaf area per plant (A), photosynthesis in ear leaf (B), ear growth rate in 2014 (C), and grain yield (D) of maize supplied with low to high phosphorus inputs in 2014 and 2015. Bars represent the standard error of the mean (n = 4). Means with no letter in common are significantly different between treatments (LSD test, α = 5%).

