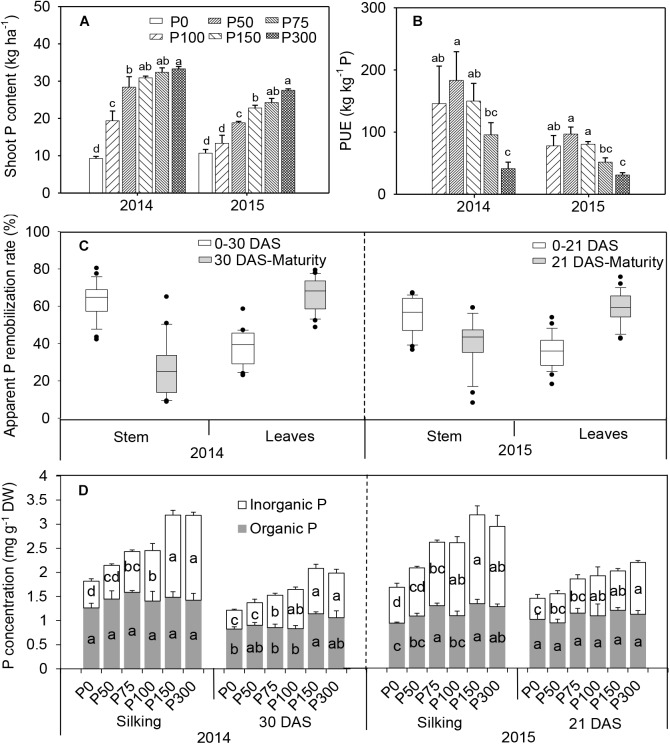
FIGURE 2.
Total shoot P uptake (A), P-use efficiency (B), apparent P remobilization from stem and leaves (C), and organic and inorganic P concentration in ear leaf (D) of maize supplied with low to high phosphorus inputs in 2014 and 2015. Bars represent the standard error of the mean (n = 4). Means with no letter in common are significantly different between treatments (LSD test, α = 5%). In panel (C), the top and bottom edges of the boxes represent the 75 and 25 percentiles, and the top and bottom bars represent the 95 and 5 percentiles of all data, respectively.

