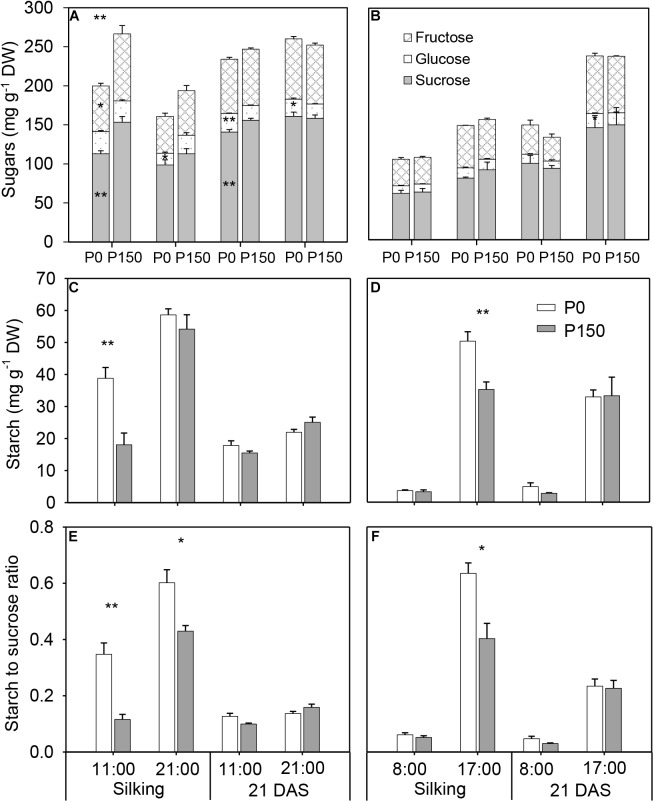
FIGURE 3.
Concentrations of sugar (A,B) and starch (C,D), and starch to sucrose ratio (E,F) in ear leaf of maize plants with low (P0) and high P (P150) supplies at silking and 21 DAS in 2015 (A,C,E) and 2016 (B,D,F). Bars represent the standard error of the mean (n = 4). Statistical differences between P levels each year are marked with asterisks (∗P < 0.05, ∗∗P < 0.01).

