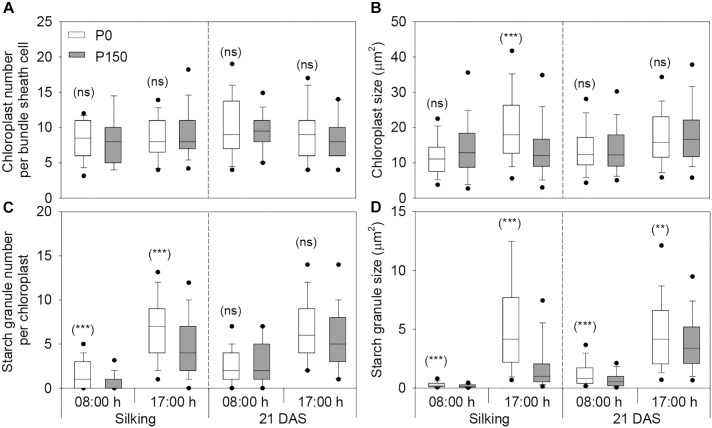
FIGURE 5.
The number and size of chloroplasts (A,B) and starch granules (C,D) in bundle sheath cells of maize ear leaf at silking and 21 DAS in 2016. The solid lines within each box represent the median values of all data. The top and bottom edges of the boxes represent the 75 and 25 percentiles, and the top and bottom bars represent the 95 and 5 percentiles of all data, respectively. Statistical differences between P levels at each time point are marked with asterisks (∗∗P < 0.01, ∗∗∗P < 0.001; ns, not significant).

