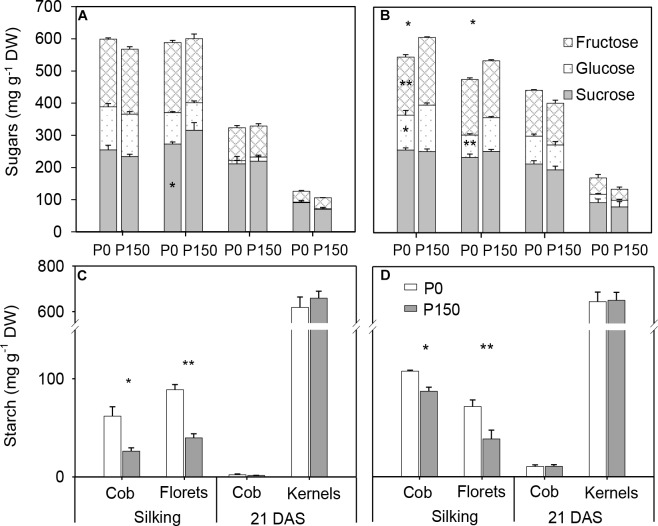
FIGURE 6.
Sugar (A,B) and starch (C,D) concentration in the ears of phosphorus deficient (P0) and phosphorus sufficient (P150) maize plants at silking and 21 DAS in 2015 (A,C) and 2016 (B,D). Bars represent the standard error of the mean (n = 4). Statistical differences between P levels in each year are marked with asterisks (∗P < 0.05, ∗∗P < 0.01).

