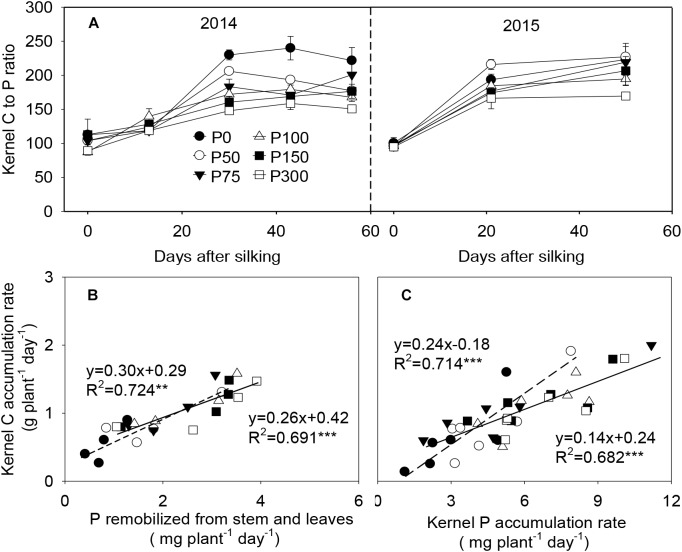
FIGURE 7.
Carbon to phosphorus content ratio (A), P remobilization rate from stem and leaves and carbon/phosphorus accumulation rate in the developing kernels of maize plants supplied with low to high phosphorus inputs (B,C) in 2014 and 2015. In panel (A), bars represent the standard error of the mean (n = 4). In panels (B,C), each data point is the mean of four replications. The short dash and solid lines represent regression under P deficiency (P0 and P50) and sufficiency (P75 to P300), respectively. ∗∗P < 0.01, ∗∗∗P < 0.001.

