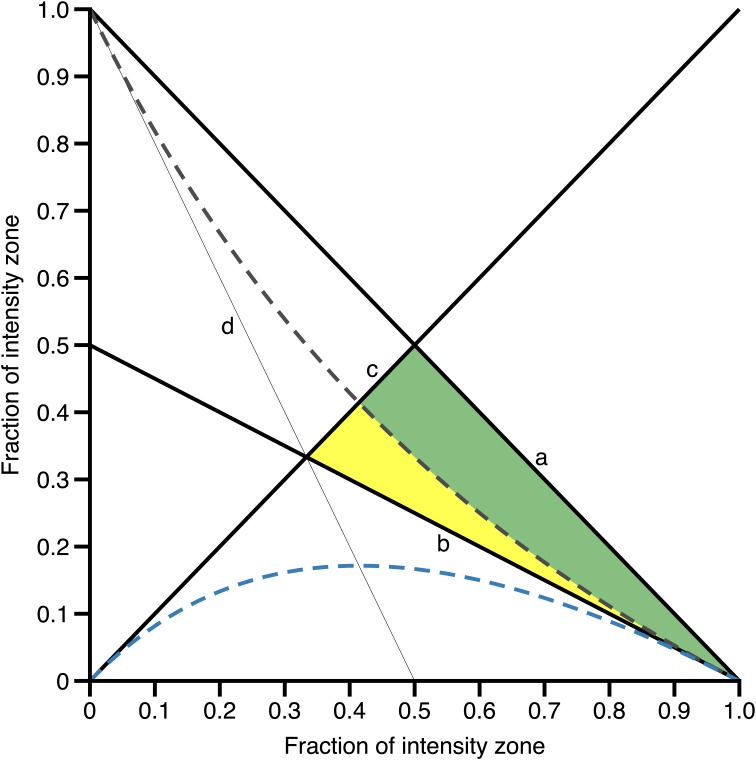
FIGURE 2.
Limits and conditions of the polarization index. Line a indicates the upper limit of Zone 3 for a given (x-axis) fraction of Zone 1 (condition a: Zone 1 + Zone 2 + Zone 3 = 1), line b indicates the lower limit of Zone 3 for a given fraction of Zone 1 (condition b: Zone 3 > Zone 2), line c indicates the upper limit of Zone 3 for a given fraction of Zone 1 (condition c: Zone 1 > Zone 3), and line d indicates the lower limit of Zone 3 for a given fraction of Zone 1 (condition d: Zone 1 > Zone 2). The colored areas represent the range of values where conditions a-d are fulfilled. The gray broken line indicates the limit of Zone 3 for a given fraction of Zone 1 resulting in a polarization-index of 2.00 a.U., i.e., if Zone 3 is higher or lower, polarization-index will result in values higher (green area) or lower than 2.00 a.U. (yellow area), respectively. The broken blue line indicates the upper limit of Zone 2 for a given fraction of Zone 1 to allow for a polarization-index ≥ 2.00 a.U.

