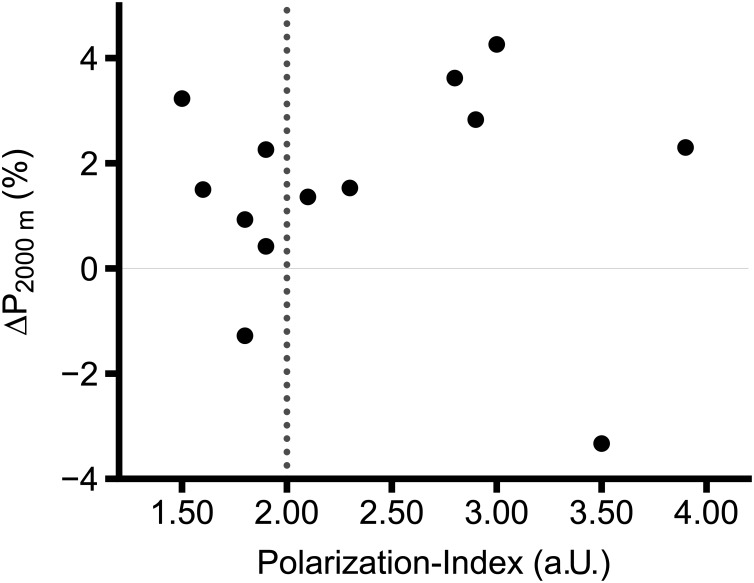
FIGURE 3.
Percentage change of average power in 2000 m rowing ergometer test (P2000m) in internationally competing rowers. Vertical dashed line represents the cut-off between non-polarized (≤ 2.00 a.U.) and polarized (> 2.00 a.U.) TIDs. Figure adapted from Treff et al. (2017).

