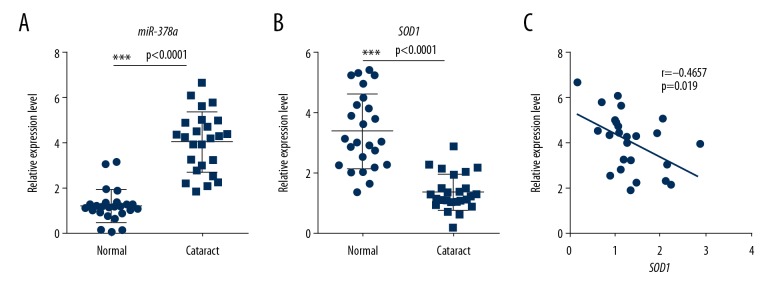
Figure 4.
microRNA-378a (miR-378a) and SOD1 levels in human cataract lens samples. (A) Quantitative reverse transcription polymerase chain reaction (RT-qPCR) analysis shows the level of miR-378a in human normal lens and cataract lens samples (n=25). All data are presented as the mean ± SD. The two-tailed unpaired Student’s t-test was performed for comparison of the two groups. (*** P<0.001). (B) RT-qPCR analysis shows the mRNA level of SOD1 in the normal human lens and cataract lens samples (n=25). All data are presented as the mean ± SD. The two-tailed unpaired Student’s t-test was performed for comparison of the two groups. (*** P<0.001). (C) Spearman’s correlation analysis shows a negative correlation between miR-378a and SOD1 in human cataract lens samples (n=25). r=−0.4657, p=0.019.

