Figure 2.
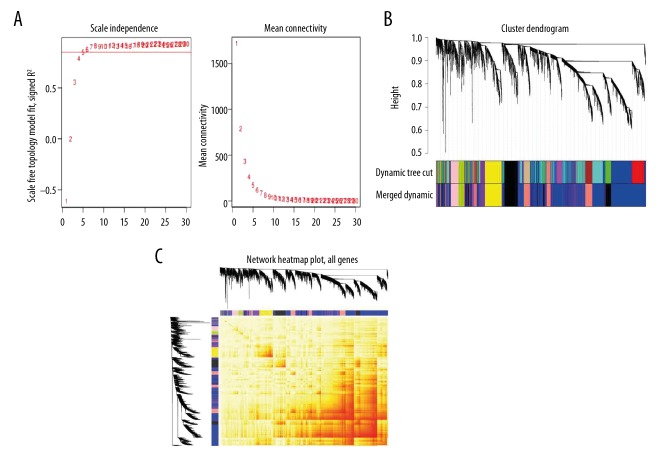
Plots in the WGCNA using gene expression profiles of biopsy samples from lesional skin of 59 AD patients in the GSE99802. (A) We selected an appropriate threshold power to make the connections between genes in the network conform to the scale-free networks. The panel on the left shows that the appropriate soft-threshold power meets the topological index >0.85; the panel on the right shows the correspondence between soft-threshold and mean connectivity. (B) Gene dendrogram of co-expression genes obtained by hierarchical clustering. The underlying color row represents the functional modules resulting from the dynamic merge. When the threshold of merging similar modules was set to 0.3, 7 main modules with different colors were obtained. (C) Heatmap of topological overlap in the gene network. The gradually saturated red color indicates a high degree of overlap between functional modules.

