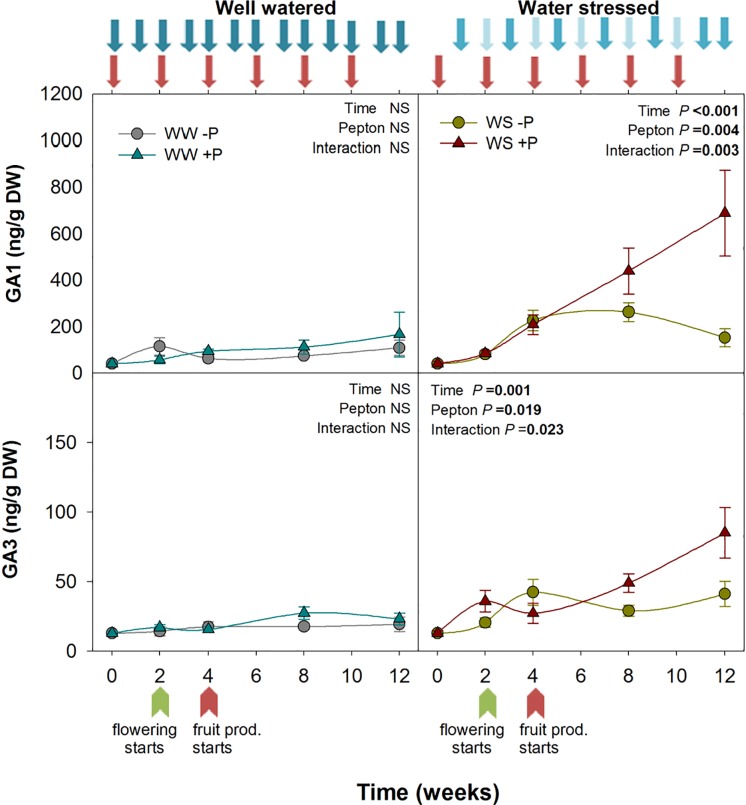
FIGURE 3.
Variations in the endogenous content of gibberellins in Pepton-treated tomato plants compared to controls under well-watered or water-stressed conditions. Data are the means ± SE of n = 10 individuals. Results of statistics (two-way ANOVA with Tukey HSD post hoc test) are shown in the inlets. Arrows represent days of watering and Pepton application. DW, dry weight.

