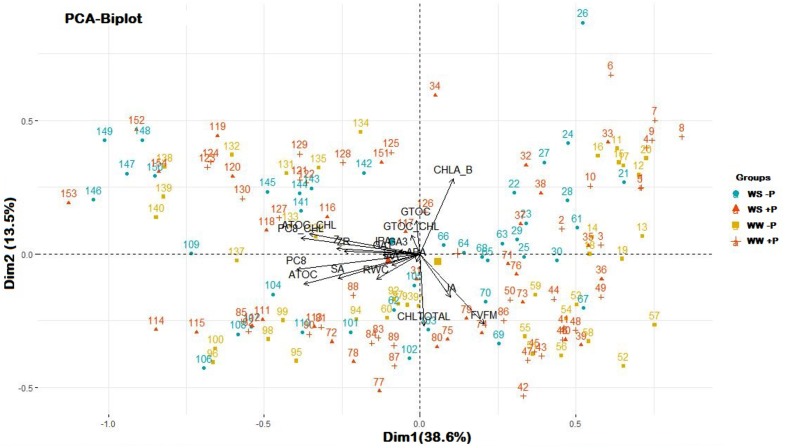
FIGURE 6.
Principal Component Analysis of all variables measured in the study. Numbers represent each observation used to perform the analysis (n = 157) and symbols with colors represent each treatment (WS, water stressed; WW, well-watered; –P, without Pepton application; +P, with Pepton application, as shown in the legend). Symbols without number are the coordinates for a given group, calculated as the mean coordinates of the individuals in the group. Arrows represent each variable measured in the study. Dim1, principal component 1; Dim2, principal component 2. Percentages indicate to what extent the component explains observed variability. ATOC, α-tocopherol; ATOC_CHL, α-tocopherol/chlorophyll; CHLA_B, chlorophyll a/chlorophyll b ratio; CHLTOTAL, chlorophyll a + chlorophyll b; GTOC, γ-tocopherol; GTOC_CHL, γ-tocopherol/chlorophyll; PC8, plastochromanol-8; PC8_CHL, plastocromanol-8/chlorophyll.

