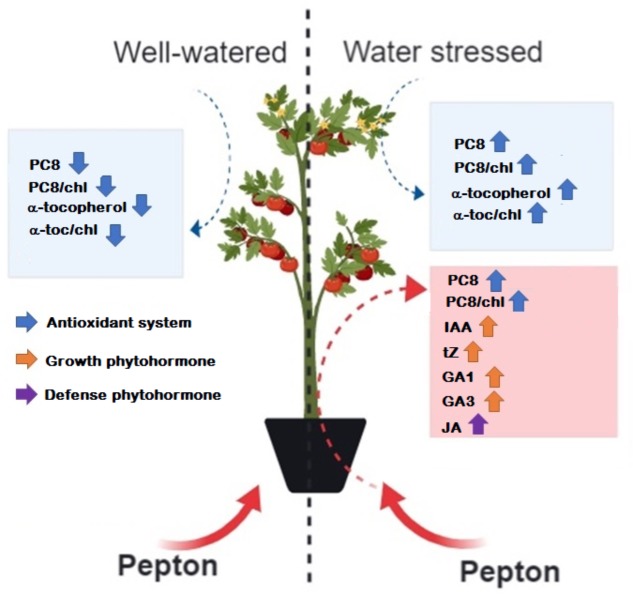
FIGURE 7.
Schematic view of Pepton effects on tomato plants under water stress conditions. Information provided by PCA and ANOVA tests were considered. Blue boxes include main water stress effects on the variables studied as indicated by PCA and red boxes indicate Pepton effects on the variables studied as indicated by ANOVA tests. α-toc, α-tocopherol; chl, chlorophyll; PC8, plastochromanol-8. This figure was made with the help of web-based program BioRender (BioRender, Toronto, Canada).

