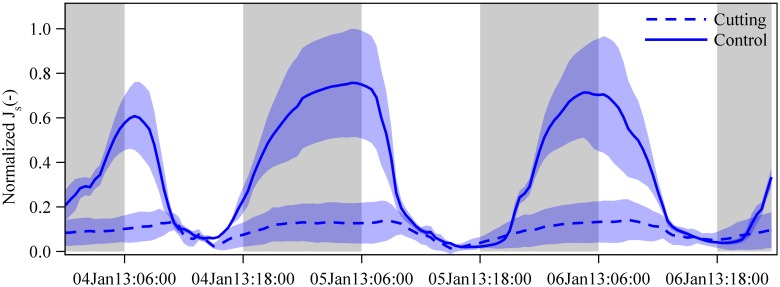
FIGURE 5.
Normalized sap flux densities (Js) in freshly sprouted culms of G. apus in cutting (dashed lines) and control clumps (solid line). In the cutting experiment clump, all established culms were removed, leaving only freshly sprouted culms. Due to missing measured data, we estimated Js of freshly sprouted G. apus culms in the control clump by multiplying Js of freshly sprouted B. vulgaris culms in a nearby clump by a ratio of 0.63 (see section “Materials and Methods” and Appendix Figure S5). Averaged data from 3 and 5 culms for the control and cutting clump, respectively, normalized by setting the hourly maximum and minimum of both datasets to one and zero. Lines represent means and error corridors around the lines indicate standard deviations.

