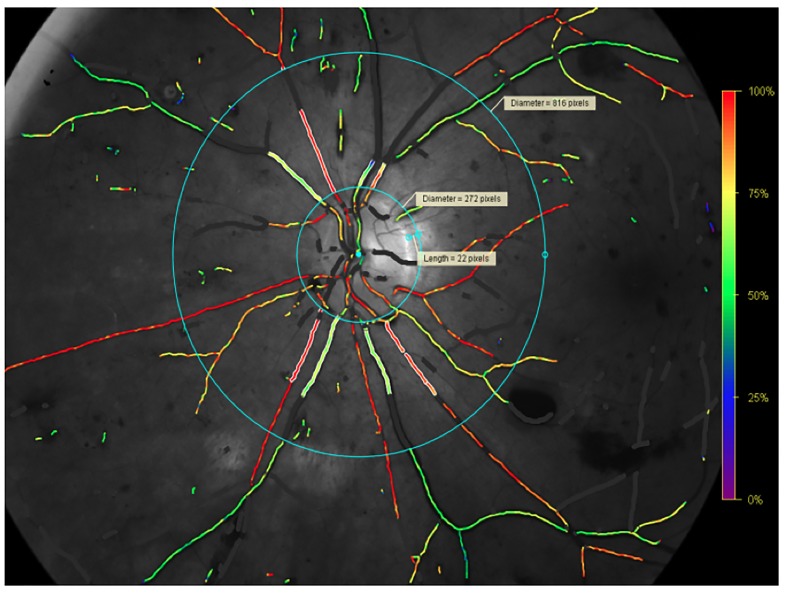
Figure 3.
Oxymap T1 image showing traced vessels with overlaying colour map indicating oxygen saturation by colour in the left eye. Between the blue rings, the oxygen saturation is measured in traced vessels, seen as white lines on either side of the vessels. Retinal vessels covered in white areas are excluded vessel segments.

