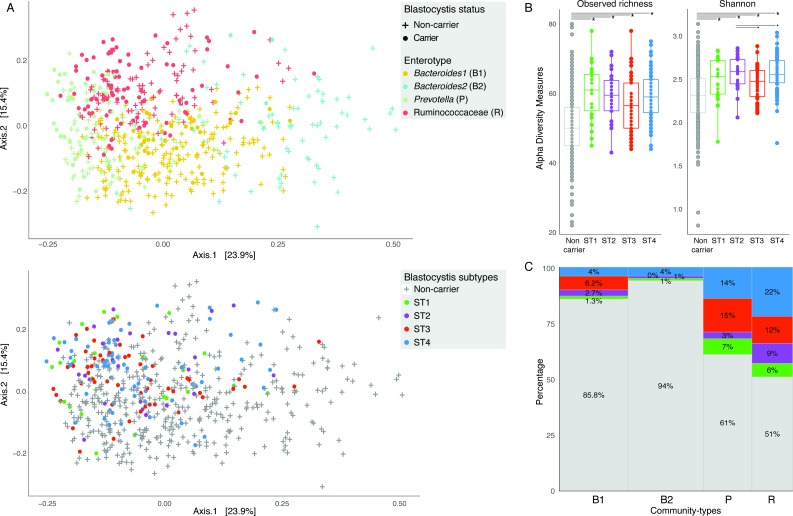
Figure 2.
Microbial community variation associated to enterotypes and Blastocystis subtypes in the Flemish Gut Flora Project (FGFP) cohort. (A) Blastocystis carrier and non-carrier individuals (top panel) and subtype carriers (bottom panel) position in microbiota community space, represented by principal coordinates analysis (PCoA) of genus-level Bray-Curtis dissimilarity of the bacterial and archaeal fraction. The percentage of variation explained by the two first PCoA dimensions is reported on the axes. (B) Observed genus richness and Shannon diversity index (SDI) across Blastocystis non-carriers and carriers grouped by subtype. Presence of Blastocystis is associated to higher richness and SDI. Subtypes ST2 and ST4 have higher SDI compared with ST3. Wilcoxon test false discovery rate (FDR): *FDR<0.01; .FDR<0.05. (C) Distribution of Blastocystis non-carrier and subtypes carriers with respect to enterotypes, using Dirichlet Multinomial Mixtures community typing (Falony et al 2016). The Ruminococcaceae and Prevotella enterotypes have a higher proportion of Blastocystis carriers than Bacteroides1 and especially Bacteroides2. The body of the box plot represents the first and third quartiles of the distribution, and the median line. The whiskers extend from the quartiles to the last data point within 1.5×IQR, with outliers beyond.

