Figure 3.
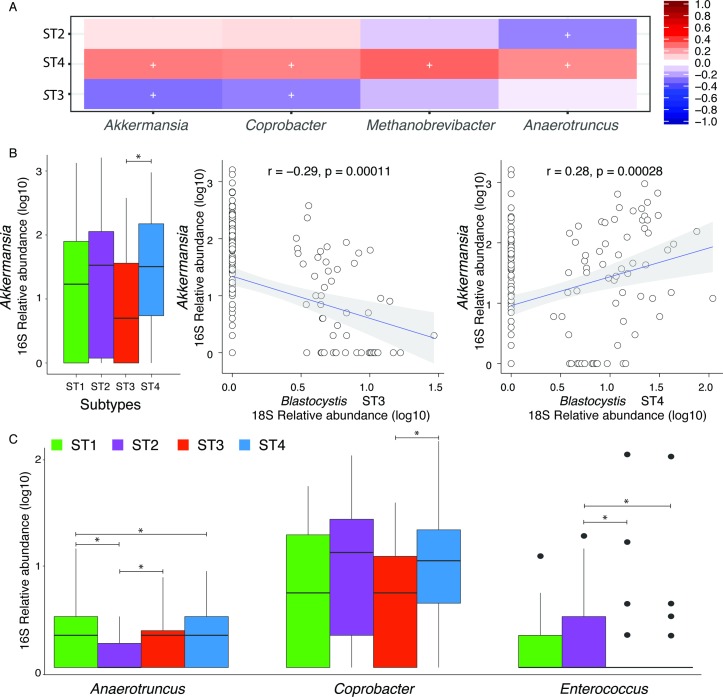
Blastocystis subtype carriers are strongly linked to microbial community composition. (A) Correlation between bacteria and archaea genera and Blastocystis subtypes. Heatmap of correlations between bacteria and archaea genera and Blastocystis subtypes is indicated by colours, positive (red) and negative (blue). The significant correlations (false discovery rate (FDR) <0.05) are indicated by ‘+’; only bacteria and archaea genera and Blastocystis subtypes with at least one significant correlation are shown. (B, C) The four genera with significant differences in relative abundances between the most prevalent Blastocystis subtypes carriers. (B) Akkermansia-relative abundances correlate negatively with abundances of Blastocystis ST3 and positively with ST4. (C) Differences in relative abundances of Anaerotruncus, Coprobacter and Enterococcus between the most prevalent Blastocystis subtypes carriers. Kruskal-Wallis with post hoc Wilcoxon test with multiple testing correction (FDR). *FDR<0.05 and Spearman correlation, FDR<0.05. The body of the boxplots represents the first and third quartiles of the distribution, and the median line. The whiskers extend from the quartiles to the last data point within 1.5×IQR, with outliers beyond.

